Wednesday, December 18, 2013

Guilty Until Proven Innocent

Guilty Until Proven Innocent
Problem:
How can you use the conservation of momentum to prove to a judge that you were not speeding and therefore do not deserve a ticket for the collision?

Materials:
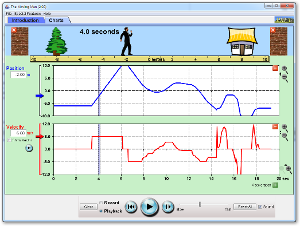
Paper, Logger Pro, video, safercar.gov, protracter, ruler.

Procedure:
You leave the school teacher's parking lot and are traveling north when you are broadsided by a car traveling east. The collision occurs in a school zone with a speed limit of 20 mph.  The impact throws you into the band practice field.
Following the collision the police officer determines that both vehicles had a speed of 22 mph (9.8 m/s). The driver of the other car is an adult and claims that you were speeding and consequently should receive a ticket. You are to prove your innocence by using the conservation of momentum.

Research:
What type of a vehicle were you driving?  What type of a vehicle was the other driver riding in?  Look again at the safety and the mass of these vehicles at the NHSTA site (http://www.safercar.gov  ).  Use the same vehicle you looked up earlier this week.

Your vehicle_______________           Mass or weight____________

Their vehicle_______________           Mass or weight____________

Decide on the units for your momentum and record here ____________

Draw a diagram of the two cars just prior to impact. You were headed north, the other car was headed East. Choose a scale (e.g., 1 cm = kg m/s) or freehand draw a diagram of the vehicles before AND after the impact your calculation .  

There are two possible cases.  In Case 1, you were going 20 mph.  In Case 2, they were going 20 mph.  One things for sure.  After the collision, you were stuck together and both of you traveled at 22 mph.

Do one set of calculations for each Case.

STEP 2:  MODEL THIS COLLISION USING two balls of similar diameters but different masses.  Because the collision described above is inelastic, the balls must stick together and slide after impact.

Summing Up (each person does this individually,1/2 to 1 page, and hands it in paper clipped to the diagrams)
1. Qualitatively explain, using your diagrams, how you know that you were not going faster than the adult. Remember that a ticket means higher insurance rates and a large fine.
2. Do you think you were you speeding?
3. How would angles affect your logic?
4. What evidence of impulse or guilt would the police collect in this action?
5.  Based on the safety rating of the vehicles involved, what do you think the extent of the injuries would be?
6.  What role did impulse play in the safety factors present in your vehicle?   

Tuesday, December 17, 2013

Pool Tables Individual Reflection

Create an INDIVIDUAL  lab report that answers the question: Was momentum mostly conserved in your data analysis?  Include EVIDENCE AND SKETCHES to back up your claim.

Did you have an mostly elastic or mostly non-elastic bumper?  How do you know?

What was the difference between the bumper collision, the 1-d collision, and the 2-d collision on the table in terms of momentum conservation.


Write a conclusion that indicates pictures and explanations of the following: 

  • inelastic collisions, 
  • elastic collisions
  • impulse in a vehicle collision
  • one-dimensional momentum
  • two-dimensional momentum
  • the law of conservation of momentum
Finally, explain why we use pool tables to discuss momentum, and other systems that would work equally as well.

Wednesday, December 11, 2013

Documentation

You need to get the videos done today and shared with me in a folder.

Go to Google Drive

Make a folder that says,  "Momentum Pool Project"

Right click on it and share with me.

Today's job is to get the videos done.  When that is finished, you will need to do SEVEN of the problems found here for Monday.  You MUST show a picture, write down masses and speeds, and write the momentum equation or the impulse equation that is used.   Since there are 30 problems to choose from, I'm sure you will all have a different mix to share with me.

Pool table documentation and video scripts

HAND IN YOUR PACKET today.


Use your phone or a video capture utility to make the videos.   You may need to convert them, so use a video converter.

You will need to upload each of these items to your Google Docs account.   Share a FOLDER with me, not individual documents.

1. Make a 30-60 second video that shows you and your pool table, it's dimensions, and it's gravity feed system.   Take a picture from above showing the break of the balls.
2. Create a one ball collision with a bumper using a video feed.
3. Comment on the elasticity of your bumper.
4. Create a two ball video between the ball and a second ball that illustrates 1-d momentum.
5. Create a two ball video between the ball and a second ball that illustrates 2-d momentum.
6. Create a two ball video between the ball and the second ball that causes both balls to rebound.
6. Analyze #3-6 using logger pro and the movie feature. Make certain you scale your picture.
7. Print your data.


You must share videos to marciarpowellATgmailDOTcom with your group member names.

Monday, December 9, 2013

Pool Table work

Part of this project of a creating a pool table involves creating a scaled model.  This can be done with Google Sketchup, on graph paper, or using Autocad or another program of choice.  Include a top, and one side view to indicate the ball return system.


You can start with a series of Google Tutorials--I like this one, but there is an entire channel devoted to Sketchup tutorials at http://www.youtube.com/user/SketchUpVideo


==========


This activity is adapted from High Tech High

You will be building a table top pool table.
Requirements

The Detailed Sketch must:
-- Be scaled-down from a full size pool table
-- Be no bigger than 65 cm * 130 cm
-- Be drawn on the computer (I would suggest Google Sketch)
-- Represent the ball return system that is gravity fed (not simply pockets)

The Pool Table must:
-- Include handmade billiard balls (golf balls allowed), cue sticks, & racking triangle
-- Be functional   (You may make ONE modification---having 4 ball holes instead of 6 ball holes)

The Ball Return System must:
-- Gather ALL the billiard balls in one area
-- Be easily accessible by the players
-- Be seamlessly integrated with the pool table

Step one: Make a materials list (cardboard is able to be used, plywood is perhaps better), assign roles, and create a sketch of your design (please submit the sketch to me via email)
Step two: Create your pool table by Monday, 11/19 and bring to class
Step three: Notes and Ideas


Momentum ideas

Wednesday, November 20, 2013

Boo....my turn for the flu

Wednesday:  finish the third page from yesterday's handout.  Read the problems, draw a force diagram for each and label the forces you can.  I will look at these tomorrow

Start taking a look at http://your29point5cmdolllovesphysics.blogspot.com/ 

Tomorrow you can start testing.  If you have a car from home that your action figure can sit in, modify the seat belt and the bumper as needed for safety.  If you do not have a car from home, there are red cars you can use in the bottom cupboard behind where Josh and Nathan sit.  Remember, you will need a front AND a back bumper.  Make an action step list of things you will need to do and bring, and your groups must be 3 or less.

Monday, November 18, 2013

Monday Blues, where Powell's kids have the stomach flus

Take your quiz.   The first problem is particularly open, so if everyone at a table picks the exact same things,  I will wonder how synced your brain waves really are.

Finish the bridge reflection if you have not as homework for tonight.

TODAY

Review the forces on this page, paying particular attention to the Frictional Force.

Do these seven problems in your notebook.  I will ask you about them tomorrow, and if you have questions.  Most likely, you will, so don't skip these, ok?

Skim these four problems if you have time.


Thursday, November 14, 2013

Constant Velocity vs. Changing Velocity in Forces

Fill in your data from the hill lab here


We have been looking at force diagrams for a while now.  Today we're going to look at a pretty realistic simulation to see how these work in applied situations.

Got to http://phet.colorado.edu/en/simulation/forces-1d and download the Java applet.

http://www.math-aids.com/images/graphing-coordinate-plane-4singles.png

1.  Apply a force until the filing cabinet moves and then push it to the house.   Sketch the Force graph with the Fapp, the Ffric, and the Fnet.   I like to hit the Pause button at the bottom and then replay to do this.

2.  Repeat with two different objects.  Note the differences by sketching both of these, with x-y labels, as well.

3.  Try to get the force net to zero for the filing cabinet while it is moving.  When you get done, take a look at the acceleration-time tab a) before the cabinet moves  b) when the cabinet starts moving   c) while the cabinet has a net zero force.


Tuesday, November 12, 2013

Answers to work


Monday, November 11, 2013

Personal Bridge Reflection (due Wednesday at the beginning of class)

Watch the video

Answer the following
  1. How much did your bridge hold?
  2. How much did it cost, and how did you minimize your costs?
  3. What is the mass of your bridge (using a scale)?  Convert to kg.
  4. Calculate the force weight of the bridge, and the force weight of the load applied.
  5. Calulate a ratio to show me the strength of the bridge (load/bridge)
  6. Using the member data sheet, which bridge member held the greatest load? How do you know?
  7. Can a member experience both compression and tension? Explain.
  8. IS your bridge model a good fit for the bridge you made in the program? Why or why not?
  9. Draw a force diagram for your bridge when the truck is on the left-hand side of the structure.
  10. How does friction matter in this project?
  11. Explain why a truss bridge is more common than a cable-stayed bridge over small creeks.
  12. What have you reinforced in this project about statics, force diagrams, angles, and vectors.

This entire sheet should be 1-2 pages long, hand-written or typed.  If you hand-write it, take a picture and upload to Google Drive.  Either way, share the docs with me at marciarpowellATgmailDOTcom

Bridge Reflection


Before you test your bridge out, please fill this

PRE_REFLECTION form out.

Test the bridge.   You will need to place it between two stools.   Place material on it, and start adding mass.  You may use 100 g or 500 g masses.

Keep track of:

____mass of bridge (kg)  Remember, 1000g = 1 kg

____mass added to the bridge (kg)   Remember to stay out of the way of the masses.  DO NOT stand under the bridge, or with your head below the bridge.

____weight of the bridge (N)   Weight on Earth = mass(kg) X a(gravity).  The acceleration of gravity on earth is about 10 m/s/s

____weight of the mass added to the bridge (N)

____ length of the bridge (cm)


Take a series of pictures of the bridge

a) before you start  (your group members should all be in this picture)
b) when it has 1 kg of mass on it
c) when it has 2 kg of mass on it
d) when it has 5 kg of mass on it.
e) when it starts to torsion
f) after a bridge collapse

Use these pictures to help you with the reflection, and email me your favorite 3.
Then, fill out the FINAL REFLECTION

Tuesday, November 5, 2013

Bridge Building

I am ill today.  Boooo

Your goal for the day is to build your bridge using a scale of 1 cm = 2 m

Upon reflection, glue guns will be faster than Elmer's glue; that said, do not make a glopping pile of goo for every joint.   The orange cards should be used for the girder.

Extra glue and straws should be in the credenza.  You may have to move the tables. to get closer to a plug in.  Popsicle sticks are under the coffee pot in the free box.

Glue gun glue gets very hot.  Have one person operate the glue gun and others use the bamboo skewer to move the pieces.


Forgot your stuff?  That's not so good.  Bridges MUST be ready at the beginning of the class Tuesday.


Here's a sneak peak of tomorrow's assignment:   http://www.physicsclassroom.com/Class/newtlaws/u2l2c.cfm

Thursday, October 24, 2013

Vector Benchmark


As a culture, we have increasingly become reliant on GPS technology.  Farming, map-making, navigation, surveying, and military identification are increasingly connected to this network of satellite locations. 

Project:


GROUP PART
A.   Explain to me, using a picture, how GPS works.  Upload this picture to your Google Drive.
B. Use Google Maps/Google Earth and find the exact location of five landmarks  to tell a story.  This could be anything from famous Iowans to places where Laura Ingalls Wilder slept---use your imagination.

INDIVIDUAL PART
Create a series of vector representations that tell me how far each landmark is from the bell of the school.  List the starting GPS coordinate to the nearest minute, the final GPS coordinate to the nearest minute, the path length/degrees, and the two legs.  Show work.


GROUP PART
 Use your understanding of GPS and/or Vectors to explain how one of the topics below work, it's advantages, disadvantages, and if your group would recommend it.
 Include a sample physics problem associated with this topic, concrete examples and graphics as appropriate, along with a Resource sheet.

You may choose something else, but here are topics to consider:
  • How 4Square and Facebook check-in work.  Advantages and disadvantages. (I'd suggest checking in at least 10 places in the Mantown area if you do this.  Use Google Earth to find the exact latitude and longitude)
  • Developing a Geocaching Hunt (Brrr...if you do this, it will be cold.  Make a hunt, but then explain exactly HOW you did it.  If you have an app to do that, explain it.)
  • Precision Agriculture (check out many of the online farm journals, or agleader.com, or other sites.  Why do they have to sample the fields to use this technology? How accurate is it? Do you want to have tractors with auto-steering?  Is this the future of farming?)
  • Military Drone Targeting (Type in a location, and a remote control bomb can drop on a location half-way across the world.  Human rights activists suggest that this technology is not as accurate as it should be, and many civilans have been harmed.)
  • Discoveries using Google Earth (military secrets, shipwrecks and hidden treasure, and perhaps undiscovered archeological finds....all from your armchair.   Where have these things been found?  What is the GPS location of some of these secrets?)
  • Using Vector-scaled technology in Powerpoint and Adobe Illustrator
  • Problems and Foibles with your Automatic Navigator (at what point should you stop listening to the voice and use your common sense?  What about the Apple Maps fiasco?  Where do the maps used in these applications come from, anyway?)
  • A GPS can be installed on cars to track a fleet, a rental car, or to check the habits of drivers in your family.    Is this the future of insurance?  Is it a benefit or an intrusion?  How do these things work?)
  • Navigation in Flight (What does it take to to be a aeroflight navigator, and how is it different than the Google Tours we just put together?  How has GPS replaced sin, cos, and tan and the Pythagorean theorem needed by navigators of the mid-century last year?
  • 3d printing is an application of vectors that can be used for a variety of purposes:  DIY hands

Grading:  
Presentation (this can be a flipped video to show to the class or you can present)--15
Digitized artifacts (upload everything to a Google Drive folder, and then share with me)--15
Demonstrated Understandings in Physics related to vectors and/or GPS--15
Quality/Resources--15

Wednesday, October 23, 2013

Trip Around the District


View Larger Map

Here are the places we spoke of yesterday.

Pick 5, and using the paper map, make an 'as-the-crow-flies' round-trip journey  Label each of these legs A, B, C, D, and E

Make a vector heading for each.

Break each Vector into components.

Calculate the net displacement for N-S and E-W


Tuesday, October 22, 2013

Map My Run Redux

Resolved:  Should Map My Runn be used as an alternative to circuits in PE class?

This is an opportunity to use non-flaming comments.

Base your comments on the following:


  • people's access to smart devices
  • the ability to game the system
  • the desire for people to live healthy lifestyles beyond that of a class
  • the ability of the app to track vectors

Comments must have your name.  You will be required to comment on someone else's statement in a way that extends the conversation.

Wednesday, October 16, 2013

Google Tour Vacation

You are headed on a dream vacation! Start at Manchester, and zoom around the globe using Google Earth in the North Lab. At least one place must be south of the equator, and place east of London. As you travel (on at least ten stops), keep track of the latitude and longitude for each place, and the vector heading from point to point

http://googleearthdesign.blogspot.com/2009/02/howto-create-simple-tour.html


Monday, October 14, 2013

Golf Course Info


Step 1: You, along with one or other designers , will be putting together a 9-hole golf course.  A lovely creek (not a river) runs through the land, and there are trees on two edges, and a housing development on a third. You will need to have PAR information to do this, but these values are approximate, so you do have some leeway.

For the purpose of this activity, cost is no object, so trees and sand traps can be added at will.

Establish a scale: ___10___ yards = 1 cm (unless you checked with instructor)

Draw a detailed sketch of your course using the paper by the meter sticks and hand in. Make sure you have added a compass rose and have marked the scale on your paper.   
Provide a vector length and heading for the first leg of each hole (We will do this on Monday).

Hints: Club houses are often 6000-15000 sq. ft. Houses are often 1800-4000 sq. ft., with the upper range representing a mansion-style home.
If you choose to make a mini-golf course,  include a clubhouse, a parking lot, 9 holes of golf, and a snack shop On one side of the course must be a go-kart course.

Monday, October 7, 2013

Putting the Pieces Together on an Individual Blog

Create a blog using Blogger.

Upload your video pieces, or embed the You Tube Clips.

Take screenshots of the data analysis.  The number--as many as necessary, with captions added.

Answer the questions for the group reflection.

DO NOT simply answer these as #1, #2, etc.   You will lose points if you do.

Share the blog title with me.

Tuesday, October 1, 2013

Stop Motion Movie

Video Analysis of Animated Motion

How good is it?  That is that question videographers have to ask each day when they put together animations, whether it it something that is created in 3d (Blender or Maya), or even a stop motion movie.


linked from http://capsicumsunset.files.wordpress.com/2008/09/wile_e_coyote-gravity-lessons.jpg
In original animations, each picture was drawn on a cellulose or acetate sheet, and then a picture was taken of each.   If you look at it frame by frame, you can see that sometimes the images were 'padded' or the same image was used twice in a film to cut down on work for the animators.  We do this today with stop motion animation, an extension of the techniques that have been around since the claymation movies.

A History of Animation tells this story well.  Animation single cells are now sold as collector pieces

In the past five years, this hand-animation has experienced a bit of a renaissance, with both Pixar and Disney doing some still work.  It takes very simple tools.

Digital tweenings then started to take over, with wire-frame animation and user-friendly programs like Flash.  These gave way to more robust programs with physics engines and 3D graphical modeling which have boosted the CGI and animation industries.  

Your project is to look at the physics of motion in movie clips.  You can do this in a variety of ways, but you will need to analyze what is created using Logger Pro.  This includes segments on constant motion, on acceleration and deceleration, and vertical motion.

Possible options include

  • making a stop motion movie
  • comparing two types of animation

Print or save each of the the Logger Pro analyses, and email them to me, as well as any video products you create.


Grading Rubric is here


=========
Group Reflection (Presentation or Linoit)  Using v(i), v(f), d, a, and t variables

1.  How well did you or others animate this project?  What specific evidence do you have to support your claim?
2.   What are three things that could have been done better in this project to mimic reality?  Again, show specific evidence.
3.   Identify a .2 sec time interval.  Identify the initial v(i), and the v(f).  Calculate an acceleration in m/s/s and calculate the distance traveled.  SHOW FORMULAS used.
4.  Find a place where the y-velocity is decreasing for .1 seconds.  Identify the v(i), the distance traveled, and calculate the acceleration in m/s/s.  SHOW FORMULAS used.
5.  Find a place where the x-velocity is relatively constant.  Identify data and calculate the acceleration.  How close does this data match to the assumption that acceleration should be zero?   SHOW FORMULAS used.
6.  Based on your work, and work done in class, which do you believe is the best type of animation:  a) hand-drawn, b) stop-motion movement, c) computer-animated children's programs, d) computer-animated for motion picture movies.    Explain this to me in 2 or more paragraphs, listing advantages and disadvantages of each.

Thursday, September 26, 2013

Edible Race Cars Thurs and Friday

Task:   Edible Race Cars.   Each member of your group must construct an entirely edible race car (except for 2 bamboo skewers, which may be used in any way desired).   The car will travel down a a ramp that has a motion detector at the top and must travel for 1 m.  Create a side view video of what is happening for each person using video.  This should be done today.

Each group must upload the Logger Pro files (the computer has a blue card taped to it) to their shared drive for Monday.  They must also upload the video file and share with me.
============

Friday, 9/27

Turn in the Map My Run assignment

Fill out this FORM individually


Variable identification practice.   Yesterday, I checked with your group on the worksheets that were available earlier in the week.  On the board by the clock are the examples for three of them.

Today, we're using a book.  (I know, tough to believe) that is on the front bookshelf.   The cover looks something like this.


Task:   Copy the motion formulas on a notecard to be placed into your calculator or binder  (they are listed below and on the board)  

Complete 7 of the 12 problems assigned by the teacher on pp. 82-83   (2, 35, 8, 9, 10, 11, 12, 14, 16, 17, 18)

FOR EACH PROBLEM or PROBLEM PART include

a) the variables  identified (must include 3)

d
v(i)
v(f)
a
t

b) a formula

c) a solution WITH PROPER LABELING (m, m/s, ft/s/s, etc.)


d = v(i)t + 1/2at^2
d = t * [v(i) + v(f)] /2

v(f) = v(i) + at

v(f)^2 = v(i)^2 + 2ad

Monday, September 23, 2013

Two Days of Hard Work

Ladies and Gentlemen,
**********************************************
Use your Map My Run data to create the following.  


  1. A total d-t graph (do not include changes in direction as negative)
  2. A total v-t graph that represents #1.
  3. A d-t graph that represents motion towards the origin as negative, and motion away from the origin as positive.  
  4. A v-t graph that represents #3
When you turn this in, include a 3 paragraph summary of how valuable this app is

a) if used with a smart phone
b) if used as a tracking website
c) if used for PE.

If you were to design an 'app', what other features would you want to include to make it more physics-friendly?
*********************************************


You have been given a suite of tools:

  • Logger Pros
  • the PHET moving man app
  • the patterns

Using those, you need to do the following and understand (the test will look a lot like these)


On Tuesday, we'll add in formulas based on the variables change in distance, initial velocity, final velocity, change in time, and acceleration


On Wednesday, we'll be building edible race cars

And on Thursday and Friday we will be working on the stop motion videos as a part of your benchmark.


Thursday, September 19, 2013

Kinematics activities

GO to http://www.mapmyrun.com and create an account, or use the app on a smartphone.

Make a public route that is at least 1 km (.6 mile long).
Walk the route by Monday and record the time for each leg (it should have at least 4 turns in it).
Share the public route with @mapowell via twitter or email.

Bring a completed diagram to class on MONDAY.
Leg  |  Time (s)

================
Seeing the patterns.

There are seven types of d-t graphs.

a) the object is not moving
b) the object is moving at a constant speed away from the origin
c) the object is moving at a constant speed towards the origin
d) the object is positively accelerating away from the origin
e) the object is negatively accelerating away from the origin
f) the object is positively accelerating towards the origin
g) the object is negatively accelerating towards the origin.


For each, please draw a d-t graph, a dot diagram, a v-t graph, and an a-t graph is if the acceleration is <> 0


================
Create four logger pro graphs using a car and a ramp

A:  The cart rolls down a ramp away from the motion detector

B:  The cart rolls down the ramp towards the motion detector

C: The cart is pushed up the ramp towards the motion detector, and then rolls back down.

D:  The car rolls down the ramp away from the motion detector, and then rolls on a level surface towards a second motion detector.


Monday, September 16, 2013

Monday, 9/16--more graphical analysis

Hi everyone, sadly I am out and ill today.  Boo.  That being said, this is a good time to get everything settled in your head.  If you have not handed in the 2 problems from Friday, you should do so

Last week, we read these three sections.  Refer to them as we think about things today.


http://www.physicsclassroom.com/Class/1DKin/u1l2b.cfm
http://www.physicsclassroom.com/Class/1DKin/u1l3a.cfm
http://www.physicsclassroom.com/Class/1DKin/u1l3b.cfm 

Part 1:  Today, you should be asking a simple question.  What patterns are present?
In short, you should be able to articulate (and hand in, at the end of class) the following:


  • if a d-t graph has a horizontal line, what will happen with the v-t graph?
  • if a d-t graph has a line with a constant positive slope, what will happen to the v-t graph?
  • if a d-t graph has a line with a constant negative slope, what will happen to the v-t graph?
  • if a d-t graph has a curve, what will happen to the v-t graph?
  • what are the corresponding dot diagrams for each of these above situations?  
  • how are dot diagrams used to help us create d-t graphs
  • how are dot diagrams used to help us indicate v-t graphs
  • what does the dot on a dot diagram represent?
Part 2: Complete and hand in the worksheet that is on my desk.   You will need to draw a d-t graph in the space below the question, and a v-t graph to the side.

Part 3:  Pick 4 of the first 6 problems at http://www.physicsclassroom.com/calcpad/1dkin/problems.cfm and create a d-t graph and a v-t graph for them. (these are due Wednesday)


Part 3:  


Friday, September 13, 2013

Analyzing Your Walk and Move Data

Today, you used a Logger Pro and different objects to try to answer the question.


Can you move with a constant speed?  Can an object move with a constant speed.   You printed a summary sheet with a d-t and a v-t graph.


  • On  each printed sheet, place your names and the Item Tested.   
  • Explain what the d-t graph tells you.  
  • Identify if their is any noise (outlying data that doesn't make sense)
  • Does the item tested have constant motion?  Explain your rationale.
  • Attach the Logger Pro files for each group to an email.  Send to marciarpowellATgmailDOTcom, and place the names of your group members in the subject line (note if anyone was absent).

Hand this in.


Wednesday, September 11, 2013

Journal Prompt

After you do FOUR of the simulations at the bottom of the last post, I'd like you to answer these questions in your Google Drive journal. 1. What is the purpose of a d vs. t graph, do you think? 2. How does a dot diagram (sometimes called a ticker tape) compare to a spedometer in a vehicle? 3. What type of tool(s) does a vehicle have to control a pretty constant speed? 4. Why can't an acceleration last forever? Think of the d-t graph. 5. What does a horizontal line on a d-t graph mean. 6. What is your comfort level with d-t graphs? 0 (yechh) to 4 (genius)

Tuesday, September 10, 2013

Tuesday

Read
http://www.physicsclassroom.com/Class/1DKin/u1l2b.cfm
http://www.physicsclassroom.com/Class/1DKin/u1l3a.cfm
http://www.physicsclassroom.com/Class/1DKin/u1l3b.cfm (sorry, Kaylar, this is where y= mx +b comes in handy)

As you read, write down your questions so we can talk about them tomorrow.


Last half of class--Motion Man Activity
This activity is done in groups of 2 or 3. If there are more than three names on a sheet, it WILL NOT be accepted. 
The Moving Man


Click to Run

Click on the activity above.  It will eventually launch a new Java script in a separate window. If you are having trouble, we can help. DO NOT click on the icon repeatedly or you will open up multiple copies of the program.


Print the Moving Man Activity for your group, or make a copy and upload to a shared Google Doc (that would be my preference). This will be handed in tomorrow  Moving Man Activity


====================================DO not start this today-=====================

NOTES and PROCESSING For the following situations, sketch a d-t, v-t, and non-zero a-t graphs that show up in your notes (this activity is modified from here). When you get done with the graphs, send me a picture for your group
A) A man moving from the left of the screen (-8 m) to the house (8m) at a constant 2 m/s (adjust the v-slider).
B) A man moving from 0 to the house at a faster pace than above. C) A man standing still at 4 m.
D) A man moving from 0 to the house at a fast pace then moving back to 0 at a slower pace (slide the man manually).
E) A man moving from 16 m to the tree m at a fast pace of (3 m/s).
F) A man moving from 0 to the house, speeding up as he walks (an acceleration of 1 m/s/s).
G) The man stands still while he talks on his cell phone at the middle of the sidewalk, then walks toward the house at a constant rate trying to get better cell reception. He comes to a sudden stop when the coverage is good (about a meter before the house) and stands still to finish his conversation.
H) The man starts close to the tree, stands still for a little while, then walks toward the house at a constant rate for a while, then slows gradually to a stop.
I) A man wakes up from his nap under the tree and speeds up toward the house. He stops because he is worried that he dropped his keys. He stands still as he searches his pockets for his keys. Once he finds them, he continues calmly to walk toward the house and then slows to a stop as he nears the door.

Friday, September 6, 2013

Motion and Dot Graphs Connection, September 6

First 20 minutes:

Step 1:  Please create your three ticker tapes.   When you get them, please write on the tape WHAT you did to get that type of tape.  Mark position 0 and tape to the whiteboard under the clock.


Step 2:  Ticker walk:  Take a strip that you believe has constant motion and one that has non-constant motion.  Get a whiteboard and divide it in half.  For the first strip, create a sample graph of total distance vs. time, and a sample graph for interval distance vs. time on the bottom half.  In both cases, time is the independent variable.  NOTE:  I said sketches, which means you do not have to measure the distance from dot to dot exactly.  Just estimate.

Step 3:  On a second whiteboard, write a CLAIM regarding your second strip.   The strip itself is EVIDENCE, but you may also want to use a graph or a table.  Here, you must represent the motion of at least half of the entire strip.  Explain your REASONING for your claim.

Second 20 minutes: Reading, class discussion and mathematical models of straight lines

Last half of class--Motion Man Activity
This activity is done in groups of 2 or 3. If there are more than three names on a sheet, it WILL NOT be accepted. 
The Moving Man


Click to Run

Click on the activity above.  It will eventually launch a new Java script in a separate window. If you are having trouble, we can help. DO NOT click on the icon repeatedly or you will open up multiple copies of the program.


Print the Moving Man Activity for your group. This will be handed in, along with your packet at the end of the class period today. Moving Man Activity


====================================DO not start this until directed-=====================

NOTES and PROCESSING For the following situations, sketch a d-t, v-t, and non-zero a-t graphs that show up in your notes (this activity is modified from here). When you get done with the graphs, send me a picture for your group
A) A man moving from the left of the screen (-8 m) to the house (8m) at a constant 2 m/s (adjust the v-slider).
B) A man moving from 0 to the house at a faster pace than above. C) A man standing still at 4 m.
D) A man moving from 0 to the house at a fast pace then moving back to 0 at a slower pace (slide the man manually).
E) A man moving from 16 m to the tree m at a fast pace of (3 m/s).
F) A man moving from 0 to the house, speeding up as he walks (an acceleration of 1 m/s/s).
G) The man stands still while he talks on his cell phone at the middle of the sidewalk, then walks toward the house at a constant rate trying to get better cell reception. He comes to a sudden stop when the coverage is good (about a meter before the house) and stands still to finish his conversation.
H) The man starts close to the tree, stands still for a little while, then walks toward the house at a constant rate for a while, then slows gradually to a stop.
I) A man wakes up from his nap under the tree and speeds up toward the house. He stops because he is worried that he dropped his keys. He stands still as he searches his pockets for his keys. Once he finds them, he continues calmly to walk toward the house and then slows to a stop as he nears the door.

Thursday, August 29, 2013

Wrap-up

At this point, almost everyone is wondering to themselves

"What does this radioactivity stuff have to do with physics anyway?"

Great question.

Physics is the study of forces, energy and motion.  There are four main forces in the universe, according to current theory

MACRO FORCES
Gravity (the weakest force)
Electromagnetism (aspects of which include all the forces we study in the rest of the class)

NUCLEAR FORCES
Weak force (also known as radioactivity)
Strong force (the holds together the pieces that make up protons and neutrons)


We've started out this class with a snippet of information about Nuclear Forces, and next week, we move on to Macro Forces for the rest of the course.  Before we do that, two things need to be accomplished.

INDIVIDUALLY complete the work shown here

Create a public service announcement about a radioactive application using one of the following isotopes.  One common application of the isotope is shown in ( ).  Use the process described in
http://www.mindspring.com/~mmm/element.html to communicate your ideas.   You must include a written plan with your video that addresses these components and answers the questions below.

  • (irradiation of spices)cobalt-60
  • Cs-133 (atomic clock)
  • Iodine-131  
  • Americium-241 (gauging plastic)
  • Americium-241 (smoke detectors)
  • (CT or PET scans ) C-11, N-13, or O-15
  • Technicium-99m
  • (Fresh food irradiation) cobalt-60
  • Leakage from Fukoshima (caesium or cesium contaminated water)
  • C-14 (radioactive dating)
  • Some other isotope of your choice
The following information must be present in your background information:
a.  What type of decay is going on?
b.  What is the half-life of the isotope, and how long will it take for 99% to disappear
c.  How can we protect humans from this type of isotope when we don't want to be exposed to it?
d. How are force or momentum used in this process?
e. How valuable is this process?
f.  How is the use of this radioactive tool comparable to a non-nuclear option.   Pick two similarities and two differences.
g. Why is radioactivity all around us?   And what's the difference between natural radioactivity and deadly radioactivity.

Upload your video to a youtube account and share with me.

Grading Rubric

Background notes and content correctness:  10 points
Entertainment value:  10 points
Use of media to enhance presentation:  10 points
Involvement by all members of group:  10 points
Title or Credits, as appropriate:  5 points

Monday, August 26, 2013

U-238 Decay

Nuclear Checkers


The Battleship Detector

Rutherford's Experiment Connections


Your goal is to try to answer the problems found below.  For each one you can use a hand-drawn chart like this one, or the table that is attached, but you MUST show your logic for each project.  Just writing down the answer will not get you credit.


1) The half life of iodine-131 is 8.040 days. What percentage of an iodine-131 sample will remain after 40.2 days?
2) The half-life of thorium-227 is 18.72 days How many days are required for three-fourths of a given amount to decay?
3) If you start with 5.32 x 10⁹ atoms of Cs-137, how much time will pass before the amount remaining is 5.20 x 10⁶? The half-life of Cs-137 is 30.17 years.
4) The half-life of the radioactive isotope phosphorus-32 is 14.3 days. How long until a sample loses 99% of its radioactivity?
5) U-238 has a half-life of 4.46 x 10⁹ years. How much U-238 should be present in a sample 2.5 x 10⁹ years old, if 2.00 grams was present initially?   (Hand this in individually)

Part 2:  Radon.  Radon is a big problem in Iowa, and the videos we watched in the last post point this out.   Design some sort of a Public Service Announcement that will highlight this concern to people in Iowa, why it is dangerous, and what they can do about it.

Friday, August 23, 2013

Friday Quiz

Please take a few minutes to do the work shown here.


FORMATIVE QUIZ

Tuesday, August 20, 2013

Alpha and Beta Decay, and the Senior Launch

Yesterday, we started looking at the idea of radioactive decay being a part of the nucleus being unstable.  Today and tomorrow, we will look in more detail at two types of decay.  For each of these, you will be going through an activity to make you think.  There is a document you can follow along with, and fill out as you go along.  Then, upload it to your Google Drive and share with me.


Part 1:

First Document   Please upload this to your Google Drive and share with me and your partners.  It should be called Beta Name (e.g., Beta Joe F and Julie K)

Second Document    Please upload this to your Google Drive and share with me and your partners.  It should be called Nuclear Process Name (e.g., Nuclear Process Joe F and Julie K)


Alpha Decay


Click to Run

Beta Decay


Part 3:  Design a lab (write a procedure) and conduct it to determine the half-life of alkaselter tablets.  In order to do this, you will need a stopwatch, tablets, and a container of water.

Make a CLAIM:

Provide EVIDENCE:  (photos, data tables, etc.)

Detail your REASONING

This will be handed in as a poster and is due Thursday morning.


Part 3:

Watch these videos and write a summary paragraph of each in your private journal with me.


Friday, August 16, 2013


What is Radioactivity


When you complete your MM/marshmallow graph, please send via 5636081900, Twitter, or Instagram.  You own this personal work, so make sure you hand it in.


Please read (as a team) or individually, this selection on radioactivity on CK12 Flexbooks.  Any notes or questions should be dated with today's date, and answered in your notebook.

Repeat the exercise, but this time, you will be using 10 of three different color cubes. The marshmallows will be replaced with black or brown cubes.  This time, you will do this with a partner and record on a whiteboard as needed.  Setup your whiteboard as shown below.

============================================


============================================

This should take us to at least 45 minutes into the period.