Wednesday, January 29, 2014

Fitness Tracks

Well, since it is  wayyyyyy to cold to use Map My Run, we'll need to use the school to develop fitness routes for winter.

photo credit: Ahmad Nawawi via photopin cc


Our data


Class assumptions
Based on our class research, a beginning route should be 1.5 mi in length, and walked with a speed of about 3 mi/hr
Based on our class research, an intermediate route should be about 3 mi in length and jogged with a speed of about 5 mi/hr.  Some steps should be included.
Based on our class research, a fast route for high aerobic value should be at least 3 mi in length and run with a speed of 7 mph.  Steps will increase the challenge.

Design your basic, intermediate, and aerobic routes.  Remember, all our measurements are in meters, so you must convert English measurements to metric. (15)

Create a drawing of each route, along with the number of laps  Your final drawing should be understandable to people who come in from the community to walk in the morning or after school.  (15)

Determine the time for one lap, based on your fitness data.  Also determine the total time it will take to complete. (18)  SHOW WORK.

If you are over or under in measurements by 100 laps, you may stop.


============Final Turn IN===============
Hand in all of your rough draft work.
Draw each of your maps on this school map   Use colored pencils or markers to make it stand out.
Each person in the group should choose ONE route to do the following (using graph paper or a spreadsheet):

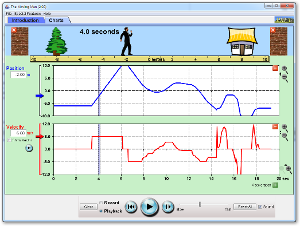
  • Make a graph for ONE lap that is total distance (not displacement) for each leg of the route.   The time for each leg should be based on the average speed of the route. (10)
  • Make a v-t graph based on d-t data. (10)
Reflection questions: (20)
1.  How likely is it that you can walk or jog at a constant speed for the route you mapped?  Explain your reasoning.
2.  Why did we map distance and not displacement on our graphs?
3.  How would the graphs change if we used velocity instead of average speed for our calculations?
4.  Create a dot diagram of the motion every 5 seconds until you get to one lap.
5.  How should we publicize this or make it available to our school and/or community to promote fitness activity?  Be specific on how you would do this.

Due Date:  Friday at 10:30

Thursday, January 16, 2014

Friday

Part 1:  Please go through all of Lesson 3 (3 screens) and Lesson 4 (4 screens)

http://www.physicsclassroom.com/Class/1DKin/U1L3a.cfm

I will be asking about the 'Check Your Understanding' problems on Monday.

Part 2:  Use the Logger Pro system and try to see if motion can be constant in real life.   Ms. D. will have different ball types (bottom cupboard, left of the sink), cars (bottom cupboard, there are red cars, and green cars (far top cabinet to the right, next to the computers).  Remember, the logger pro gold dot only works if it can see the ball.  This means that you need to adjust the height of the logger pro. After each trial, save the Logger Pro file to the desktop. Attach to an email and mail to me, or upload in a Google Doc.

Monday, January 13, 2014

Welcome to Physics

Digital Details
  • shared google files
  • google drive app on phone
  • mapowell.org shortcut on phone?
  • marciaruthpowellATgmailDOTcom or marciapowellATw-delaware.k12.ia.us

Motion and Dot Graphs Connection

First 20 minutes:

Step 1:  Please create your three ticker tapes.   When you get them, please write on the tape WHAT you did to get that type of tape.  Mark position 0 and tape to the whiteboard under the clock.


Step 2:  Ticker walk:  Take a strip that you believe has constant motion and one that has non-constant motion.  Get a whiteboard and divide it in half.  For the first strip, create a sample graph of total distance vs. time, and a sample graph for interval distance vs. time on the bottom half.  In both cases, time is the independent variable.  NOTE:  I said sketches, which means you do not have to measure the distance from dot to dot exactly.  Just estimate.

Step 3:  On a second whiteboard, write a CLAIM regarding your second strip.   The strip itself is EVIDENCE, but you may also want to use a graph or a table.  Here, you must represent the motion of at least half of the entire strip.  Explain your REASONING for your claim.

Second 20 minutes: Reading, class discussion and mathematical models of straight lines

Last half of class--Motion Man Activity
This activity is done in groups of 2 or 3. If there are more than three names on a sheet, it WILL NOT be accepted. 
The Moving Man


Click to Run

Click on the activity above.  It will eventually launch a new Java script in a separate window. If you are having trouble, we can help. DO NOT click on the icon repeatedly or you will open up multiple copies of the program.


Print the Moving Man Activity for your group. This will be handed in, along with your packet at the end of the class period today. Moving Man Activity


====================================DO not start this until directed-=====================

NOTES and PROCESSING For the following situations, sketch a d-t, v-t, and non-zero a-t graphs that show up in your notes (this activity is modified from here). When you get done with the graphs, send me a picture for your group
A) A man moving from the left of the screen (-8 m) to the house (8m) at a constant 2 m/s (adjust the v-slider).
B) A man moving from 0 to the house at a faster pace than above. C) A man standing still at 4 m.
D) A man moving from 0 to the house at a fast pace then moving back to 0 at a slower pace (slide the man manually).
E) A man moving from 16 m to the tree m at a fast pace of (3 m/s).
F) A man moving from 0 to the house, speeding up as he walks (an acceleration of 1 m/s/s).
G) The man stands still while he talks on his cell phone at the middle of the sidewalk, then walks toward the house at a constant rate trying to get better cell reception. He comes to a sudden stop when the coverage is good (about a meter before the house) and stands still to finish his conversation.
H) The man starts close to the tree, stands still for a little while, then walks toward the house at a constant rate for a while, then slows gradually to a stop.
I) A man wakes up from his nap under the tree and speeds up toward the house. He stops because he is worried that he dropped his keys. He stands still as he searches his pockets for his keys. Once he finds them, he continues calmly to walk toward the house and then slows to a stop as he nears the door.

Friday, January 10, 2014

Thursday, January 9, 2014

Data collection on Projectiles

You built a catapult or you captured a screencaster vision of a video game.. 

Catapult:  Adjust it so that it is capable of launching a large marshmallow or wiffle ball from a distance of 3 to 5 meters, and hitting a target that is .30 m high +/- .10 m. You will have 5 trials to hit your target at each distance on Friday, and will be graded according to your accuracy. (10 points)

OR

Video game:  know the game well enough that you can hit the target that I choose multiple times in a row.  You will have 5 trials to prove your mastery of the game, and will be graded according to accuracy (10 points)

Rubric and Questions for Analysis

Using your logger pro data, answer the questions below INDIVIDUALLY and hand in

Where is the biggest frictional in your machine or the game? Explain why this matters to the range. (3 pts)

Determine the maximum range for your machine or game by scaling a known value.. Make at chart that lists all the variables available for y(up), y(down), and x. Below the table, show me or tell me how you arrived at each number.(15 points--one for each variable)
How could you determine F(net) of the projectile?  Draw a force diagram and sent to me? (3 points)
How will the net force of the projectile change if we use another projectile of a different mass?  Be specific. Why?(3 points)

Pick a change in time of .3 seconds somewhere on your Logger Pro data set. Based on your data, determine v(i) at the beginning of the interval and v(f) at the end of the interval in the x and the y directions Using this data, calculate a 'practical' value for the acceleration in the x and the acceleration in the y-directions. Choose your interval carefully so you are not mixing y(up) and y(down. (6 points)

Write a three to five paragraph summary of how you would change the design if you built another machine, and what you have learned about projectiles and engineering design. Include the following terms: potential energy to kinetic energy changes, frictional force, net force, acceleration of gravity, vectors, kinematic equations, independent x and y motions. (15 points)

TO HAND IN:   
a screencast or video with all names attached to it.
an individual review
a Logger Pro screenshot which has data marked on it.


Thursday, January 2, 2014

Using Projectiles

Today's Goal
  • Predict how varying initial conditions affect a projectile path.
  • Use reasoning to explain the predictions.
  • Explain projectile motion terms in their own words.
  • Describe why using the simulation is a good method for studying projectiles.

Use this simulation to help answer the following questions.  For each problem you solve, you must include 

  1. a sketch
  2. the project chart (all 15 variables) for any problem marked with a **
  3. any assumptions you had to make
  4. all data you measured from the simulation marked in a colored pencil
  5. all data you calculated marked with pencil and work shown.

The project chart


projectile sim


  1. One day after school, you pick up a cracked golf ball in the back yard. You decide to throw it in the trash can with an initial velocity of 3 m/s. What affects whether or not it gets in the can?  **

2. The Projectile Motion sim allows several variables that can change: you can change the height of the cannon, the location of the cannon, its angle, etc. A tape measure is present to help you measure heights and distances. Use the sim to test your ideas about the things that affect the landing spot of a projectile. 

Make a complete list of things that affect the landing site of a projectile

Next to each item, briefly explain why you think the landing location changes.
Compare your list with another group, discuss your explanations and make modifications.

3. Use the simulation to investigate how the different objects in the simulation affect the shape of the flight path. Summarize your discoveries by including examples with friction and without in the explanations for  different flight paths.

4. Launch an object from the cannon at a 30 degree angle and make it hit the target. List the angle, initial speed, and mass of the object before you start.   Resolve the initial speed into an x-speed and a y-speed using a vector diagram.  Why do these speeds change over time? **

5. Suppose your friend asks you to tell them about projectiles. You start to explain, but she interrupts. “Wait,” she says, “You’re using a lot of words I don’t understand. Can you explain in English?” Knowing that a picture is worth a thousand words, you draw a picture of a projectile path and label all the terms that are on the simulation page. Draw a picture like you would for your friend and write what you would tell her about the terms. 

6. Make a perfect parabola projectile with the cannon.   Measure d(x) and d(y) down (careful, the distance tool may not work well here), and fill out the project chart, assuming that gravity is -9.8 m/s/s.


7.  Throw a set of car keys or pencil into the air and watch it land.   Clearly identify the error sources the simulation eliminates or minimizes, compared to launching projectiles yourself and studying the actual flight path and landing spot.

8.  Make a chart that goes up by 10 degrees each time, starting with 0 degrees and ending with 90 degrees.  Mark the distance in meters traveled for each time.  Now, make a x-y graph of the angle vs. distance, where angle is the x-variable.

9.  Hand in.