Thursday, December 10, 2009

Friday, 12/11/09

Welcome back!  I am gone today because of a doctor's appointment.  Please do the following.

1.  Take your test.  If you do not feel comfortable taking your test at this time, please tweet me before 10 am.

2.  In the computer lab, work with the following simulation.  This should take about 35 minutes.  You are expected to gather data and work as a team of two or a maximum of three.  Submit a data report before you leave, highlighting with a box or marker what you feel are the important conclusions from the following.

Today's Goal
  • Predict how varying initial conditions affect a projectile path.
  • Use reasoning to explain the predictions.
  • Explain projectile motion terms in their own words.
  • Describe why using the simulation is a good method for studying projectiles.

1. One day after school, you are enjoying a soda in the back yard. When the can is empty, you decide to throw it in the trash can. What affects whether or not it gets in the can?

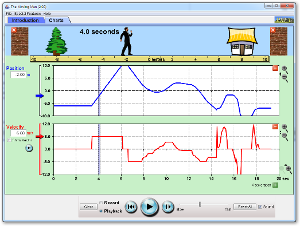
2. Open the Projectile Motion sim. Play around with the various things you can change: you can change the height of the cannon, the location of the cannon, its angle, etc. A tape measure is present to help you measure heights and distances. Use the sim to test your ideas about the things that affect the landing spot of a projectile.
Make a complete list of things that affect the landing site of a projectile including your ideas from question #1 and any discoveries you made using the simulation.
Next to each item, briefly explain why you think the landing location changes.
Compare your list with another group, discuss your explanations and make modifications.

3. Draw the flight path of your soda can and describe the shape. Use the simulation to investigate how the items you listed in #2 affect the shape of the flight path. Summarize your discoveries including explanations for the different flight paths.

4. Launch an object from the cannon and make it hit the target. List the angle, initial speed, and mass of the object.

5. Suppose your friend asks you to tell them about projectiles. You start to explain, but she interrupts. “Wait,” she says, “You’re using a lot of words I don’t understand. Can you explain in English?” Knowing that a picture is worth a thousand words, you draw a picture of a projectile path and label all the terms that are on the simulation page. Draw a picture like you would for your friend and write what you would tell her about the terms.

6. Describe why using the simulation is a good method for studying projectiles. Clearly identify the error sources the simulation eliminates or minimizes, compared to launching projectiles yourself and studying the actual flight path and landing spot.

Wednesday, December 2, 2009

Momentum of a Video Game

Get your game from miniclip.com or candystand.com Remember, the goal is not to WIN the game; rather, it is to get TWO examples of momentum.


Use a screen capture utility of your choice to capture the video. I use Quick Screen Recorder

Send the .avi file to me at marciarpowell@gmail.com If the file is larger than 10 megs, you will need to send it using send6.com

Analyze the video. Calculate the momentum before the collision, and the momentum AFTER the collision for the two sources. Repeat for the second momentum event.

Create an INDIVIDUAL  lab report that answers the question: Are computer games realistic examples of physics? Include your data, sketches as necessary, and any oddities you find. Also include any assumptions you made and a mathematical example of the calculations you did.

Write a conclusion that indicates your understanding of the following: inelastic collisions, elastic collisions, impulse, one-dimensional momentum, two-dimensional momentum, and the law of conservation of momentum. 

Thursday, November 19, 2009

Review for Friday's quiz


WS1
1a. The diagram is the At rest diagram, above
1b. Floor force = Force weight = 85 kg * 10 m/s/s = 850 N
2a. The diagram is the Accelerating upward diagram, above
b. The Fnet= 2.0 m/s/s*85kg = 170 N= F(up) -850 N F(up) = 1020 N
3a. The diagram is the Accelerating downward diagram,above.
3b. The Fnet= 3m/s/s*85kg= 255 N -255N=F(up) -850N F(up) = 595 N
4 The cable breaks,which is the top diagram. F(net) = F(w), because F(up)=0 The scale does not register.

WS2 (We went over thesein class) #1, #2

The Second WS2, #3
When you resolve the triangle, the horizontal portion pulling left = 200N The net force = 200N-75N. Fnet= m*a = 125N= 70kg*a a= 125N/70kg = 1.8m/s/s
WS4, #2
b.Constant speed means Fnet =0, so Fa=Ff= 50N
Mu = 50 N/300 N

c. If friction ended AFTER the object was launched, it’s Net force would be 50 N. 50 N = 30 Kg * a

3. Mu = Ff/FN .15=Ff/500N Ff= .15*500N = 75N
Fnet = Fa + Ff = 100 N – 75N = 25 N 25 N = Fnet = m*a 25N/50 kg = .5m/s/s

Wednesday, November 4, 2009

Forces in 1D

Complete the worksheet given in class.  If you get done early, study something else or surf with discretion.  Thx.


Moving Man Applet

Forces in 1-D

Friday, October 30, 2009

Unit IV Review


5.  a, b, c, d
6. c
7.  a,b,c, d
8. d
9.c
10.a, d
11. a
12.  depends on how you define the system.  the horse and cart are balance, as the horse does not get ahead of the cart so far that it eomes unattached.  But the NET force of the horse and cart are unbalanced, so I would probably answer with the NET force, which is a
13.  For the same reasons as 12, I would a
14-17.


Thursday, October 29, 2009

Reflection on Bridge Building

  1. How much did your bridge hold?
  2. How much did it cost, and how did you minimize your costs?
  3. What is the mass of your bridge?
  4. Calculate the force weight of the bridge, and the force weight of the load applied.
  5. Using the member data sheet, which bridge member held the greatest load? How do you know?
  6. Can a member experience both compression and tension? Explain.
  7. IS your bridge model a good fit for the bridge you made in the program? Why or why not?
  8. Draw a force diagram for your bridge when the truck is on the left-hand side of the structure.
  9. How does friction matter in this project?
  10. What have you learned in this project about statics, force diagrams, angles, and vectors.

This entire sheet should be about 1 page long, hand-written or typed, and due on Tuesday.

Tuesday, October 27, 2009

Build Your Own Bridge


Today, you will be building a static bridge using the West Point Bridge Designer  .  This is designed to test your knowledge of force vectors.

Build your bridge using the software, and send me the .bdc file at marciarpowellATgmail.com .  You will need to print a copy of the bridge design AND a copy of the truss information.  If you do not do this, you will need to redo your bridge.

After your bridge design is completed, you will build a model using manila folder for truss holders, popsicle sticks, and glue gun glue.  You also may use two pieces of corrugated cardboard that are no bigger than 3" x 12" each.  Designs must be completed in class, and the members of the bridge must be appropriately scaled.

You will get points for a) the most cost-efficient bridge b) the amount of mass your bridge can hold and c) a writeup on the project.  This is the benchmark for the statics portion of the class.  Expect a test next Tuesday.

Sunday, October 11, 2009

A Dream Vacation: Courtesy of Vectors and Google Earth

You are headed on a dream vacation! Start at Manchester, and zoom around the globe using Google Earth in the North Lab. As you travel (on at least 10 stops), keep track of the latitude and longitude for each place, and create a scrapbook of activities and interesting highlights (You can print photos, and please write down 2 or 3 observations for each place. Ask other classmates who scrapbook for ideas...

Note the length and the angle of each leg of your trip. If you get done with this, you may start on the Day 2 activities.. Text or tweet me with questions.


REFLECTION QUESTIONS

  • When you are finished, determine the net displacement from Manchester to your last location. Include a vector heading.
  • Hand in your mercator projection graph, as well as the product detailing your trip, by the end of the day on Friday.

  • Reflection questions that must be answered INDIVIDUALLY on the back of one of the graph sheets.
a) Would Google Earth or the graph be better for pilots?
b) which type of graph type would be better for detailing component vectors? Break ONE vector on that graph into its components. Show this on your reflection sheet,and indicate the starting and finishing locations.
c) based on the graph, could we easily determine a scale where 1cm = _____ miles. Why or why not?
d) how does a GPS use vector determinations as it calculates location?
e) Give three examples where a vector must be exact to the nearest mm.
f) Give three examples where a vector must be exact to the nearest m.
g) Give three examples where a vector must be exact to the nearest km.
h) Given what you have learned about vectors, where in your future career would you use vectors? Explain in 2-3 sentences.

Thursday, September 24, 2009

Cartoon Analysis


Over the next three days, you will be creating a spreadsheet that details the use of motion in Cartoon Physics. Before you start, you must pick a video and identify where you feel constant velocity, uniform horizontal acceleration and uniform vertical acceleration is taking place.

Wednesday, September 23, 2009

Edible Car Writeup

Right click here and copy the file to your desktop.  You will need to open Windows Movie Maker OR Logger Pro, and then insert the movie.

Analyze ONE of the clips, and tell me if it is your own:

Sample #:
Average Velocity
V(i) at the beginning of the ramp
A of deceleration (m/s/s)

Write a 2 to 6 paragraph reflection that details your observations, your efforts, and your modifications.  This should be posted as a blog post comment on this site (remember, you need to login with a Google user/password)

Monday, September 21, 2009

Edible Race Cars


Purpose: To design, construct, and race cars to maximize either their displacement, Δx,
or average velocity,
• All components of the race car must be materials that are edible for humans,
with the exception of 2 bamboo shish kabob skewers;
• All cars must have four separate wheels (two on one side and two on the
other side of one axle does not count).  Wheels or the wheel/axle must revolve and be
fixed below the vehicle;
• Race cars must move a minimum of 1 m in a forward direction from the
bottom of the launch ramp;
• The race car should be no larger than 30 cm x 30 cm x 30 cm.

Requirements for written portion:
• As you build your car and test it prior to the in-class race day, keep a written
record of any modifications you make to improve its performance. Include
what you tried and why it did or didn’t work well. Describe why you chose
each component in your final design and how it optimizes the performance of
your car.
• INCLUDE A PHOTO of your car and email it to marciarpowellATgmail.com or twitpic it to me.

• Look up and write down the definitions and/or equations for “displacement”
and “average velocity.” You will need to know these on race day to make
your measurements and do your calculations.
On race day:
• Your car will be launched from a ramp propped up to form a 30º angle with
the floor. A line is drawn crosswise 1.00 m above the bottom of the ramp. The
front end of the car is lined up with the edge of the marked line and released
from rest.
• Displacement is measured from the bottom of the ramp to the stopping point
of the furthest part of the car.).
• Time is measured with photogates for the first 1.00 m from the bottom of the
ramp, and for the total trial.
Data:
displacement from the end of the ramp to stopping point: Δx = ______________
time from end of ramp until the 1.00m mark: t = ______________
time from the end of the ramp to stopping t(total)=_____________

Calculations (show work!):
average velocity of car in the first 1.00 m:  = ______________
average deceleration value of your car in the total trip =____________ m/s/s

Lab Rubric for Grading will be developed in class

Monday, September 14, 2009

Friday, September 11, 2009

Answers to Practice Test

Name

Date Pd

UNIT II: Test - v1

For each of the following graphs in questions 1-4:
a. Describe, using a clear, complete sentence, how the motion of object 2 differs from the motion of object 1. Explain how you know.
b. Sketch the graph of velocity vs time for object 1 and object 2. (label clearly)
c. In the space provided, draw motion maps for object 1 and object 2.
1.


Object 2 is going faster than object 1. The v-t line for object 2 should be a horizontal line above the x-axis, the v-t line for object 1 should be a horizontal line between the x-axis and the line for 2. The motion map spacing for object 2 should be further apart than object 1
2.
Object 2 is going the same speed as object 1. The v-t line for object 2 should be a horizontal line above the x-axis, the v-t line for object 1 should be the same as object 2. The motion map spacing for object 2 should be the same as object 1, but object 1 starts at the origin, and object 2 starts to the right of object 1

3. Object 1 is going faster than object 2, and object 2 is walking towards the origin. The v-t line for object 2 should be a horizontal line below the x-axis, the v-t line for object 1 should be a horizontal line above the x-axis. The motion map spacing for object 1 should be further apart than object 2. Object 1 starts at the origin and moves right. Object 2 starts on the right side and moves left.

4.
Object 2 is not moving, and object 1 is moving away from the origin.. The v-t line for object 2 should be a horizontal line on the x-axis, the v-t line for object 1 should be a horizontal line above the x-axis. The motion map spacing for object 2 should be dots on that are not moving, starting at a point to the right of the origin, and the dots for 1 are moving away from the origin to the right.

5. DONE IN CLASS

6. DONE IN CLASS

7. Consider the position vs time graph for Flipper below
a) Determine Flipper's average speed. Show your work.

The slope of the line is change in y/change in x = 30 m/6 s = 5 m/s

b) Mathematically model the relationship between position and time.

Y=5x +0

c) What will Flipper's position be at 8.0 s? Show how you got your answer.

Y = 5*8+0 = 40 m


8. DONE in CLASS

9. DONE in CLASS

Friday, September 4, 2009

Lab in class...practice with motion maps

I have a family emergency, so I will not be in today. If you need more information, ask PT.


Group work:
Go to Name that Motion and go through the tutorial to increase your understanding of motion maps. TWEET any questions to me at Twitter.

Group work 2:

Go to SaferCar.gov and suggest a three used vehicles (1998-2006) for mapowell to consider buying, since her van is not doing very well. Consider safety rating, mileage, and seat belts (I need at 6 to 8 buckles). You will need to click the link in the middle column to get safety information. Include your rationale and the evidence you gather, and hand in as a one page document for your group.

Individual work 3: Try the next worksheet in the packet. On Tuesday, we will catch up, and you will get the retake material.

Happy Labor Day!

Wednesday, September 2, 2009

Sunday, August 30, 2009

Sample Test, Unit 1

Sample Quiz

UNIT 1 GOALS

Benchmark Sci.Phys1.1: Using inquiry, students will model the concepts of nuclear radiation and and the four fundamental forces.

Components

Sci.Phys1.1.1 Use modeling and half-life curves to identify the probability structure behind radioactive decay.
Sci.Phys1.1.2 Students will compare and contrast the energy level and frequency of alpha, beta, and gamma decay.
Sci.Phys1.1.3 Students will contrast forces inside and outside of the atoms.
Sci.Phys1.1.4 Students will discuss the historical development of technology for use in applications of radioactivity.
Sci.Phys1.1.5 Students will identify the four fundamental forces in the standard model, and explore the relationships among the components.

Tuesday, August 25, 2009

PETScans


What type of particles are used in a PETScan tracer?
What type of decay occurs?
What is the mechanism?
How does this show up to the medical personnel?