I. Creating acceleration graphs. Until this point, we have only moved at a constant speed. But that's not how the world always works.
Use a board (found between the two 4-drawer filing cabinet) that is place on a book or two to create a ramp. DO NOT MAKE THE RAMP VERY STEEP. Use a non-motorized car (they are green, and found in the far right hand cupboard by the window), and a logger pro to create four d-t and v-t graphs
Trial 1: Place the logger pro at the top of the ramp. Let go of the car so it rolls down.
Trial 2: Place the logger pro at the bottom of the ramp. Place the car at the top of the ramp and let it roll down towards the logger pro.
Trial 3: Place the logger pro at the top of the ramp. Place the car at the bottom of the ramp. Give it a sharp push so it rolls up and down the ramp.
Trial 4: Place the logger pro at the bottom of the ramp. Place the car at the bottom of the ramp. Give it a sharp push so it rolls up and down the ramp.
Print each of the 4 trials. Each printed sheet should have a d-t and a v-t graph.
II. Be ready to explain the difference between speed and velocity by reading the Physics Classroom The animations and problems on this page are really helpful, and should help increase your understanding.
III. Check your understanding of the first 4 trials by thinking about what is happening to the velocity in each case (the acceleration is always a negative value of 10, which is considered to be caused by gravity). Use this applet or the motion man applet to check your answers
IV. Finish the packet. At this point, you should be able to do that with ease.
Monday, August 27, 2012
Thursday, August 23, 2012
Aug 24: Motion Graphs with Moving Man
This activity is done in groups of 2 or 3. If there are more than three names on a sheet, it WILL NOT be accepted. This is a continuation of the graphing of this week, and yes, you've been patient. I realize it may be getting annoying. Bear with me, please?
| Click to Run |
Click on the activity above. It will eventually launch a new Java script in a separate window. If you are having trouble, Ryan can help. DO NOT click on the icon repeatedly or you will open up multiple copies of the program.
Print the Moving Man Activity for your group. This will be handed in, along with your packet at the end of the class period today.
Moving Man Activity
NOTES and PROCESSING
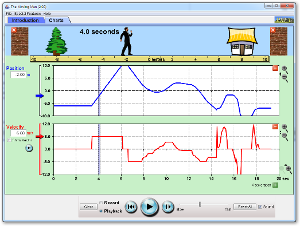
For the following situations, sketch a d-t, v-t, and non-zero a-t graphs that show up in your notes (this activity is modified from here). When you get done with the graphs, send me a picture for your group
A) A man moving from the left of the screen (-8 m) to the house (8m)
at a constant 2 m/s (adjust the v-slider).
B) A man moving from 0 to the house at a faster pace than above.
C) A man standing still at 4 m.
D) A man moving from 0 to the house at a fast pace then moving back to 0 at a slower pace (slide the man manually).
E) A man moving from 16 m to the tree m at a fast pace of (3 m/s).
F) A man moving from 0 to the house, speeding up as he walks (an acceleration of 1 m/s/s).
G) The man stands still while he talks on his cell phone at the middle of the sidewalk, then walks toward the house at a constant rate trying to get better cell reception. He comes to a sudden stop when the coverage is good (about a meter before the house) and stands still to finish his conversation.
H) The man starts close to the tree, stands still for a little while, then walks toward the house at a constant rate for a while, then slows gradually to a stop.
I) A man wakes up from his nap under the tree and speeds up toward the house. He stops because he is worried that he dropped his keys. He stands still as he searches his pockets for his keys. Once he finds them, he continues calmly to walk toward the house and then slows to a stop as he nears the door.
Monday, August 20, 2012
Aug 20
I. Today we will be looking at the data and trendlines, and the linearization of data.
In other words, how can we manipulate data to get a straight line using Excel?
You and two other people need to read up on this idea.

Discuss linearizing data II. From there, we will be starting to look at data collection using the dot method. You will need to pick up a packet and complete WS1
Discuss linearizing data II. From there, we will be starting to look at data collection using the dot method. You will need to pick up a packet and complete WS1
Friday, August 17, 2012
Aug 17
Today we will be analyzing data.
Step 1: Open up an excel spreadsheet and enter your data into columns. Make sure the labels (like inches or centimeters) are in the top column.
We will be making a series of x-y scattergraphs.
Circumference vs. Diameter
Diameter vs. Circumference
Diameter Squared vs Circumference
Circumference Squared vs Diameter
Step 2: Experiment with making the Charts
Step 3: Experiment with a best fit line
Step 4: Upload to Google Docs
Aug 16
Welcome to Science Interactions! I'm so glad you're here. Today's goals:
- Expectations
- Logging onto Google
- Your First Email
Ways to reach me:
Skype: marcia_powell
Cell: fivesixthree-six0eight-nineteenhundred
Email: marciapowellATw-delaware.k12.ia.us
Twitter: @mapowell
::mapowell::
Subscribe to:
Comments (Atom)