Tuesday, February 28, 2012

Edible Race Cars.

Design a car that will go down a 1 meter ramp and travel 1 meter on a flat surface.   Take a side view video of the event, upload to Google Docs/share.

Take a Logger Pro trial of the car as it travels down the ramp.  Save the .cmbl file and upload to your Google Docs/share.

Autoscale the Logger Pro data and print off the graph.  Mark an A point and the B point to show the start of the acceleration and a point near the bottom of the ramp.  Print this graph.

Calculate/show the following:


  • distance from A to B
  • time elapsed
  • v(i)
  • v(f)
  • a(ramp)


Now, determine a way (using your video) to find the a(deceleration) of the floor surface.   One way is to open the video using Windows Live Movie Maker, which gives you a frame-by-frame analysis.  Detail your method.


Answer the following questions INDIVIDUALLY.

a) what process did you use to decide on what type of a car to build?
b) what did you have to overcome to get the wheels to spin?
c) was your car able to travel a consistent distance?  How do you know?
d) what would you do differently if you built the car again?
e) was the wheel design or the body design more critical.  Explain.
f) how many data trials did you conduct?  How confident are you that your video was a reliable representation of what your car could do?

If you were to draw a d-t graph for the entire interval of motion, what would it look like?

Tuesday, February 21, 2012

Using the Graphs to Find Equations

Today, we'll take a look at how those graphs we've been using work into the kinematic equations.  It's a process that uses area and slope and replaces the graph model with a formulaic mathematical model.

WS 1-4 must be done at the the beginning of class tomorrow.

===============
Determining your vertical jump rate using the data from Logger Pro.

Yesterday, we all took the time to do a vertical jump.   Your goal is to calculate your rate of deceleration as you went up and the rate of acceleration as you went back down.  

For the jump, use the data points at the bottom of the jump and the top to determine v(f), distance vertical, and elapsed time.   Calculate your v(i) and your acceleration, based on this assumption.   Show work.

For the acceleration rate back down use your v(f) at the top of the jump, the distance vertical, and the elapsed time.   Calculate your v(f) at the instant before you hit the ground, and your acceleration, based on these assumptions.  Show work.

Friday, February 17, 2012

Friday, 2/17/2012

Today we made notecards to talk about the 4 types of patterns available in a curved graph. If you've been gone, we should sit down and do this together. We discussed the rest of WS1, including #4 and #5, via discussion We completed WS2a and compared qualitative and quantitative graphs WS3 was assigned for homework.

Thursday, February 16, 2012

Using d-t, v-t, and a-t graphs

Today we'll be starting with a motion detector and the Logger Pro. Complete the d-t graph and the v-t graph for each of the three scenarios presented.

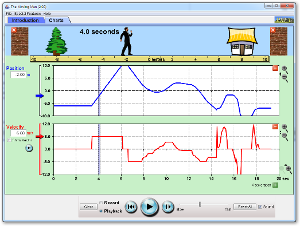
 Then, head to the Moving Man Simulation found at PHET by clicking the link below:
The Moving Man


Click to Run


CLICK ON THE CHARTS TAB
  • For trial 1, enter in the following values: x=0, v=0, a = +1
  • For trial 2, enter in the following values: x=0, v=0, a = -1
  • For trial 3, enter in the following values: x=0. v=0, a = -1

The graphs in simulation should mimic what you have in logger pro, but with one difference: the a-t graph is valid. Logger pro is not good at generating a-t graphs using a motion detector. Discussion questions to consider   include:

  1. What would a dot diagram look like for each of the situations? Be sure to mark zero.
  2. Are you able to calculate the slope of the d-t or v-t graphs? Why or why not?
  3. What's the difference between a slope of an interval and a slope of an instant?
  4. How could you calculate the slope of an instant? Explain.
  5. What does the area under a v-t or a-t graph tell you? Explain?

Monday, February 13, 2012

Quiz

Quiz questions

Angry Birds Analysis

Take a look at this picture.  You can see hoof prints of an animal at the bottom right side of the nest.  It reminds me, just a little bit, of the dot diagrams we have done all unit.

And that's also what we created when we took the Jing videos, and then took equal interval snapshots.  Your task today is to pick an three objects and track them from shot to shot, creating a dot diagram for the vertical and horizontal motion of each.   This will give you a total of 6 ten-dot diagrams.   IF the objects are no longer visible, then you will need to define the assumption.

Your 6 graphs will need to be created in Google Docs and shared.  When you finish, you will need to answer the reflection questions below and place into the form.

Tuesday, February 7, 2012

Week of 2/6 to 2/10

Well, this is a busy week. We've got parent-teacher conferences, a day off, and lots of physics to do. Shortened classes mean that we've got to get to work.

Your goals:

  •  Be able to go from d-t to v-t graphs and vice versa. 
  •  Develop models that are mathematical for d-t and v-t graphs. 
  •  Collect data on motion by playing fruit ninja or angry birds. 
  •  Analyze that data using a .swf collected from JING. 


And get ready to take a quiz on Friday or Monday. Ready, set, go!

Friday, February 3, 2012

Friday, 2/3

Walk this Way 
Worksheet 2
  Activities 1.1 to 1.3

 Oh yeah, and just for those who asked.....

Wednesday, February 1, 2012