Hi, Ladies and Gentlemen:
As you saw when you walked in, I am not there. You can contact me by text and I will send out a video invitation if you would like to talk and figure out how we should proceed on these problems.
You have my cell #. Please, contact me if you are struggling.
Wednesday, December 19, 2012
Tuesday, December 18, 2012
Projectile Problems
SHOW ALL WORK and FORMULAS
1. A rock is thrown with an initial vertical velocity component of 30 m/s and an initial horizontal velocity component of 40 m/s.
a. What will the distance to which the rock rises?
b. Assuming the launch and landing heights are the same, how long will the rock be in the air?
c. Assuming the launch and landing heights are the same, how far will the rock land from where it was thrown?
SHOW ALL WORK and FORMULAS
2. A ball rolls off of a diving board that is 3 meters above the water. It's horizontal speed is 1 m/s.
a. Determine the x-distance that the ball will land from the edge of the board.
b. How long will it take for the ball to hit the water?
SHOW ALL WORK and FORMULAS
3. A football kicker aims the ball down the field, and it rises to a height of 10 meters before dropping in a perfect parabola.
a. How long will it remain in the air?
b. If it's x-velocity is 5 m/s, how far will it travel?
c. Challenge Problem: The minimum height to land over the the goal post is 3 m. What is the maximum distance, in meters, that the field goal kicker can be away from the post?
SHOW ALL WORK and FORMULAS
4. A ball drops from the top of its parabola downward, and hits the ground with a v(f) of 14 m/s.
a. How high did the ball rise?
b. What is the total time the ball is in the air?
c. If the ball traveled 6 m horizontally, what is the speed in the x-direction?
d. Can you say v(i) up = v(f) down are equal in the y-direction if this is a perfect parabola? Why or why not?
TURN IN ALL WORK BEFORE YOU LEAVE. THIS MUST BE DONE INDIVIDUALLY.
| variable | x | y(up) | y(down) |
| d | |||
| v(i) | |||
| v(f) | |||
| a | |||
| t |
1. A rock is thrown with an initial vertical velocity component of 30 m/s and an initial horizontal velocity component of 40 m/s.
a. What will the distance to which the rock rises?
b. Assuming the launch and landing heights are the same, how long will the rock be in the air?
c. Assuming the launch and landing heights are the same, how far will the rock land from where it was thrown?
SHOW ALL WORK and FORMULAS
| variable | x | y(up) | y(down) |
| d | |||
| v(i) | |||
| v(f) | |||
| a | |||
| t |
2. A ball rolls off of a diving board that is 3 meters above the water. It's horizontal speed is 1 m/s.
a. Determine the x-distance that the ball will land from the edge of the board.
b. How long will it take for the ball to hit the water?
SHOW ALL WORK and FORMULAS
| variable | x | y(up) | y(down) |
| d | |||
| v(i) | |||
| v(f) | |||
| a | |||
| t |
3. A football kicker aims the ball down the field, and it rises to a height of 10 meters before dropping in a perfect parabola.
a. How long will it remain in the air?
b. If it's x-velocity is 5 m/s, how far will it travel?
c. Challenge Problem: The minimum height to land over the the goal post is 3 m. What is the maximum distance, in meters, that the field goal kicker can be away from the post?
SHOW ALL WORK and FORMULAS
| variable | x | y(up) | y(down) |
| d | |||
| v(i) | |||
| v(f) | |||
| a | |||
| t |
4. A ball drops from the top of its parabola downward, and hits the ground with a v(f) of 14 m/s.
a. How high did the ball rise?
b. What is the total time the ball is in the air?
c. If the ball traveled 6 m horizontally, what is the speed in the x-direction?
d. Can you say v(i) up = v(f) down are equal in the y-direction if this is a perfect parabola? Why or why not?
TURN IN ALL WORK BEFORE YOU LEAVE. THIS MUST BE DONE INDIVIDUALLY.
Thursday, December 13, 2012
Read:
http://www.physicsclassroom.com/Class/vectors/u3l2a.cfm
http://www.physicsclassroom.com/Class/vectors/u3l2b.cfm
Use the marbles and golf balls found in the bottom cabinet ( to the left of the sink by my desk.) Set up a ramp using the active physics books...the spine crease makes a great ramp.
Complete the lab found here
===Tyler, Seth, and Cameron, please text me regarding the parking lot project===
Wednesday, December 12, 2012
Marshmallow Catapults
http://www.devincollier.com/2011/04/16/how-to-build-a-simple-small-marshmallow-catapult/
http://www.hometrainingtools.com/mousetrap-catapult-project/a/1577/
Shoot the Marshmallows. Collect Data and Observations
Sample Data and Observation Sheet
http://www.hometrainingtools.com/mousetrap-catapult-project/a/1577/
Shoot the Marshmallows. Collect Data and Observations
Sample Data and Observation Sheet
Tuesday, December 11, 2012
Create, INDIVIDUALLY, four problems that deal with safety in the parking lot.
Links of help:
Physics for Engineers
Seatbelts
Pole Problems
Physics Problems Set
Crash Reconstruction
SaferCar.gov
Links of help:
Physics for Engineers
Seatbelts
Pole Problems
Physics Problems Set
Crash Reconstruction
SaferCar.gov
- One problem must deal with a person who drops something in the crosswalk and is tragically struck by a car traveling. Include details on the streets involved, the momentum before, and the momentum after.
- One problem must deal with a vehicle that hits the power pole.
- One problem must deal with an inelastic collision between two vehicles.
- One problem must deal with the impulse experienced by someone in the accident.
Your problems must be different from anyone else. The four, handwritten problems are due at 10:30.
Wednesday, December 5, 2012
Safety Project
View Larger Map
Goal: Take a position about the safety or non-safety of the intersection of Prospect, Sherman, and the faculty parking lot. Support with evidence, calculations, and models.
I. Model the setting using an acceptable scale. Model will be graded on accuracy, quality and usability for the presentation.
II. Model sample situations that can happen at the intersection, including:
a. a situation that will have 2d momentum and a collision
b. a situation that will force a driver to stop suddenly when an obstacle appears in the pathway
c. a comparison of the same car driving the same location at different speeds.
d. a problem that deals with net force, mu, or stopping distances under different weather conditions.
e. solve each of the situations in a-d, showing all work
III. Recommendations for the area of interest, including
a. dimensions
b. anticipated costs
c. rationale
IV. Presentation that explains recommendations and models the most likely sample situations. This presentation must include the scale model and will be video-taped. Creation of interest is critical.
Dr. Rickey doc
Thursday, November 29, 2012
Physics of Impulse
Today, you will be figuring the impulse of three different systems using videos. In each, you will need to determine the mass of a ball in kg, so you will need to use the logger pro and a force probe as a scale. Attach a cup to the force scale, weigh it, drop in the ball, weigh it, and then subtract the difference. Convert that value to kg using F=ma Show work on one of the trials.
Trial 1: What impulse is transferred from a pool cue to the cue ball during a hit?
Trial 2: What impulse is transferred from the cue ball to the ball that is hit?
Trial 3: What impulse is transferred from a ball to the bumper as it is hit.
Analzye the three videos on logger pro to determine the change in velocity. The time it takes for the collision will show on the dot-analysis. For each printed trail, show me the calculation for the change in velocity (v(final) - v(initial), the change in momentum (m* change in velocity), the impulse value, and the Force applied.
Tuesday, November 27, 2012
11/28/12
Today, you will be looking at two simulations. First, go to
http://www.squadron13.com/games/collision/collision.htm
Try
For each one of these, describe what happens BEFORE and AFTER the collision by writing a sentence and making a diagram. Each person should do this individually.
========
Next, go to http://www.physicsclassroom.com/class/momentum/u4l1b.cfm and work through problems 1 through 7 at the bottom of the page. The answer is listed, but I want to see your diagram of BEFORE and AFTER, as well as your work. Each person should do this individually.
http://www.squadron13.com/games/collision/collision.htm
Try
- head on collisions
- glancing blows,
- a collision between a heavy ball and a heavy ball,
- a collision between heavy ball and a light ball,
- a collision between two balls of medium mass.
For each one of these, describe what happens BEFORE and AFTER the collision by writing a sentence and making a diagram. Each person should do this individually.
========
Next, go to http://www.physicsclassroom.com/class/momentum/u4l1b.cfm and work through problems 1 through 7 at the bottom of the page. The answer is listed, but I want to see your diagram of BEFORE and AFTER, as well as your work. Each person should do this individually.
Tomorrow, we will be trying to collect information on IMPULSE using the pool tables. What is the critical information to know.
Hand in your work at the end of the hour.
Monday, November 26, 2012
1d collisions on Pool Tables
Use your phone or a flip video to make the videos. You may need to convert them, so use a video converter.
You will need to upload each of these items to your Google Docs account. Make sure it is in an .avi or .wmv (Windows Live Movie Maker) format and is less than 50 mb.
1. Make a 30-60 second video that shows you and your pool table, it's dimensions, and it's gravity feed system. Take a picture from above showing the break of the balls.
2. Create a one ball collision with a bumper using a video feed.
4. Create a two ball video between the ball and a second ball that illustrates 1-d momentum.
5. Create a two ball video between the ball and a second ball that illustrates 1-d momentum where the pool ball stops.
6. Analyze #2-5 using logger pro and the movie feature. Make certain you scale your picture. Here's a tutorial if you need it.
7. Print your data.
I
Thursday, November 15, 2012
Using Google Sketchup for a Project
Part of this project of a creating a pool table involves scaling a model using Google Sketchup, a 3D modeling tool.
You can start with a series of Google Tutorials--I like this one, but there is an entire channel devoted to Sketchup tutorials at http://www.youtube.com/user/SketchUpVideo
==========

This activity is adapted from High Tech High
You will be building a table top pool table.
Requirements
The Detailed Sketch must:
-- Be scaled-down from a full size pool table
-- Be no bigger than 65 cm * 130 cm
-- Be drawn on the computer (I would suggest Google Sketch)
-- Represent the ball return system that is gravity fed (not simply pockets)
The Pool Table must:
-- Include handmade billiard balls (golf balls allowed), cue sticks, & racking triangle
-- Be functional (You may make ONE modification---having 4 ball holes instead of 6 ball holes)
The Ball Return System must:
-- Gather ALL the billiard balls in one area
-- Be easily accessible by the players
-- Be seamlessly integrated with the pool table
Step one: Make a materials list (cardboard is able to be used, plywood is perhaps better), assign roles, and create a sketch of your design (please submit the sketch to me via email)
Step two: Create your pool table by Monday, 11/19 and bring to class
Step three: Notes and Ideas
Momentum ideas
You can start with a series of Google Tutorials--I like this one, but there is an entire channel devoted to Sketchup tutorials at http://www.youtube.com/user/SketchUpVideo
==========
This activity is adapted from High Tech High
You will be building a table top pool table.
Requirements
The Detailed Sketch must:
-- Be scaled-down from a full size pool table
-- Be no bigger than 65 cm * 130 cm
-- Be drawn on the computer (I would suggest Google Sketch)
-- Represent the ball return system that is gravity fed (not simply pockets)
The Pool Table must:
-- Include handmade billiard balls (golf balls allowed), cue sticks, & racking triangle
-- Be functional (You may make ONE modification---having 4 ball holes instead of 6 ball holes)
The Ball Return System must:
-- Gather ALL the billiard balls in one area
-- Be easily accessible by the players
-- Be seamlessly integrated with the pool table
Step one: Make a materials list (cardboard is able to be used, plywood is perhaps better), assign roles, and create a sketch of your design (please submit the sketch to me via email)
Step two: Create your pool table by Monday, 11/19 and bring to class
Step three: Notes and Ideas
Momentum ideas
Friday, November 9, 2012
11/12/2012 Veterans Day and Momentum
First 45 minutes: Practice Assessment
==============
http://phet.colorado.edu/files/activities/3324/PhET_Collision_Lab.doc
11/9/2012
Finish the Barbie writeups.
5 question quiz on Monday (sorry) on net forces horizontally and vertically.
CHAPTER REFLECTION
5 question quiz on Monday (sorry) on net forces horizontally and vertically.
CHAPTER REFLECTION
Wednesday, November 7, 2012
Bungie Barbie

Procedures:
Produce as least 5 different graphs by dropping Barbie with different cords. Use the evidence to collect a rationale for the common use of rubber as a bungie cord, and whether it is supported by your data.
Print or save your graphs for each "jump". Clearly indicate which cord or material was used. Also include information such as the amount of force and the time over which the force was applied. Record any relevant observations you saw during the jump. Hint (this works best if you upload each of the five files to a Google Doc folder, and then share down to your individual machine)
Calculate the Fup on Barbie and her g-force for each jump using a printed sketch of the graph and data from your trials. This must be accompanied by a free body diagram.
Individual WRITEUP (5 to 8 paragraphs, plus tables)
- Describe the ideal harness for a bungie jumper so that net force is distributed across the barbie. This should be based on data you gathered when Barbie parachuted, your seatbelt harness, and this lab. A picture may be helpful here.
- Explain how the total time for the Barbie to stop jumping can affect a force distribution. (Think carefully: F=ma, but a = change in velocity/change in time)
- Based on your data, is it possible to argue that there is a better material for a bungie jump than rubber? Why or why not?
- Your seatbelt lab, your parachute jump, and the bungie jump all allowed you to gather g-force acceleration data. Create a table of g-force information and tell me which is the safest situation: the Barbie bumper crash, the Barbie parachuting, or the Barbie Bungie jumping?
- What do these labs tell you about extreme sports?
- What questions arose in the lab? What information have you found?
Friday, November 2, 2012
Parachute Barbie
Today you will need to complete the Barbie parachute jump three times today.
Measure the time it takes to drop the Barbie to the ground three times, using a stopwatch.
Using a force probe that is connected to a Logger pro, measure the Force weight of the Barbie and chute.
Divide by 9.8 m/s/s to get Barbie and chute's mass in kg.
Take a picture of the Barbie, in its harness, AND a picture of the parachute and harness system. Txt or email it to me, with your group member names
Reflection
Monday, October 29, 2012
Testing the Barbie Car.
Please do the following:
1. Take a picture of Barbie in the car and out of the car.
2. Measure Mu of the floor and your Barbie system by using the force probe over by the printer.
3. Measure the angle of the ramp used to accelerate Barbie.
4. You will run Barbie down the ramp 3 times
1. Take a picture of Barbie in the car and out of the car.
2. Measure Mu of the floor and your Barbie system by using the force probe over by the printer.
3. Measure the angle of the ramp used to accelerate Barbie.
4. You will run Barbie down the ramp 3 times
- for time #1, use the logger pro and create a distance graph as Barbie comes down the ramp, but before the vehicle crashes. Print the graph and the data table. Mark the starting point with a piece of tape
- Attach an accelerometer to Barbie's lap and to the front of the vehicle, just inside the red lip of the cart. Run the car with the front Bumper. Print the graphs and the data table.
- Repeat, but this time, use the back Bumper. Barbie will be facing uphill in this trial. Again, print the graphs and the data table.
5. Draw a force diagram for Barbie on the hill (break down the Force normal and the Force down the hill using a scaled diagram or trig). Calculate MU of the board.
6. Draw a force diagram for Barbie on the floor. Label F(f), Force(weight), Force(normal), and F(net). Show calculations for F(applied)
7. Calculate how many g-forces Barbie had acting on her by dividing the accelerometer value by 9.8, the value of 1 g.
1) Vertical axis g-force:
a) positive: untrained: 5 g; trained, with special suit: 9 g
b) negative (drive blood to the head): - 3 g
c) instantaneous: 40 g
d) deadly: 100 g (record: 179 g)
2) Horizontal axis g-force
"The human body is considerably more able to survive g-forces that are perpendicular to the spine."
Untrained humans:
a) pushing the body backwards: 17 g
b) pushing the body forwards: 12 g
3) "Strongest g-forces survived by humans
Voluntarily: Colonel John Stapp in 1954 sustained 46.2 g in a rocket sled, while conducting research on the effects of human deceleration.
Involuntarily: Formula One racing car driver David Purley survived an estimated 179.8 g in 1977 when he decelerated from 173 km·h−1 (108 mph) to 0 in a distance of 66 cm (26 inches) after his throttle got stuck wide open and he hit a wall."
Source for all quotes and further information:
http://en.wikipedia.org/wiki/G-force
Analysis:
Write a group report. Different people can do different parts, but I should see evidence of everyone's efforts in the process.
- Which bumper worked better? How do you know?
- What does your calculation of MU look like on the floor and on the hill? (you may want to take pictures of your work and upload)
- Explain your design process and seat belt.
- Does Barbie survive your collisions?
- What was the effect of the roll-cage? Could you simulate something with our equipment to show this?
- What have you learned?
Thursday, October 25, 2012
Car Safety Systems: Barbie's First Test
Take a look at common high-tech safety systems and basic safety systems.
Make a list of at least 5 features you wish to build into your Barbie design vehicle.
Find the Fw of the Barbie and the Fw of the car before testing the vehicle. Record separately.
http://www.youtube.com/watch?v=Jbg-daPUT_I

Task: Between now and Monday, you will design a safety system for a Barbie and her car. It must include:
Make a list of at least 5 features you wish to build into your Barbie design vehicle.
Find the Fw of the Barbie and the Fw of the car before testing the vehicle. Record separately.
http://www.youtube.com/watch?v=Jbg-daPUT_I
Task: Between now and Monday, you will design a safety system for a Barbie and her car. It must include:
- a seat
- a rollcage
- two different bumpers
- a seatbelt
Barbie or GI Joe must be able to get in or out of the vehicle easily.
Materials are flexible; however, you may not use a balloon or ziploc bag
Be prepared to share your documentation on Monday. You may either type it into a shared Google Doc, or write it and send it to me via a series of .jpgs.
Friday, October 19, 2012
Sunday, October 14, 2012
10/15-10/10 Bridge Design and Execution
Go to http://bridgecontest.usma.edu/ and download the 2012 software. Run the install program and decide on your bridge.(pwd: ad9der1)
Your goal for day one is to get a working bridge that is NOT a suspension bridge, and then minimize costs.
You will receive points for
Your goal for day one is to get a working bridge that is NOT a suspension bridge, and then minimize costs.
You will receive points for
- the weight your bridge can hold
- the design cost of your bridge
- the aesthetics of your bridge design and its build
- the agreement in design size between your bridge and your model
When you get a working design, you will need to save the file and minimize the costs. When you think you are done, send me a copy of the design file.
Building the model:
You may use straws (a hollow core structure) or a bamboo skewer model. Please bring these on Tuesday, as well as glue guns and glue sticks. Your group size must be 3 or less.
Your reflection of the bridge is found here. It must be completed individually. Thanks!
Your reflection of the bridge is found here. It must be completed individually. Thanks!

Tuesday, October 9, 2012
10/9 DUE DATE is tomorrow
Today, you need to figure out how 'MapMyRide' and the 'Facebook/Foursquare' sharing work. You need to finish the vector work you started. And....you need to fill out the Google form on the previous post (that needs to be done individually).
GPS technology has a lot of benefits, but it is also is a concern for privacy advocates. Your phone can serve as a beacon for your location, which could be good or could be bad. Sharing your location voluntarily can let you meet up with friends on an impromptu basis, or it can allow someone to creep on you. We are able to pinpoint and strike locations militarily and we are able to farm acres with more precision. Even our weather can be pinpointed. So where is the balance, and how will you use GPS technology? That is the point of the second question, and should be a paragraph or two long.
Questions....please call me at 5636081900 or skype me at marcia_powell
Friday, October 5, 2012
Vector representations
Project:
A. Explain to me, using a hand-drawn picture, how GPS works.
B. Use Google Maps/Google Earth and find the exact location of five landmarks in the West Delaware District. Create a series of vector representations that tell me how far each landmark is from the old front door of the school. List the starting GPS coordinate, the final GPS coordinate, the path length/degrees, and the two legs.
C. Check into these location, as well as the school using a GPS receiver or a smartphone software tool. If you choose to use the GPS, you will need to geocache the trip.
Common smartphone tools:
- Facebook checkin video (you would need to friend me)
- Foursquare (again, friend me)
- Mapmyride.com or the video explanation
Turn in your completed project by Tuesday at the end of class. Groups larger than 3 will not be accepted.
Wednesday, October 3, 2012
10/3 and 10/4 Google Earth Vector Trip

Your goal is to take a 6 stop trip around the world, starting and ending someplace in the West Delaware school district. Along the way, scrapbook, in some way, the important landmarks you find. You may have one partner.
Use the path feature of Google earth to help you determine the vector for each, and separate into component legs. This form will be helpful.
When we get done, we will write a reflection on what you've found out. Expect this at the beginning of the class on Friday.
Grading is highlighted by the checklist found here
Friday, September 28, 2012
9/28 Intro to Vectors

Step 1: You, along with one or other designers , will be putting together a 9-hole golf course. The maximum area available for the golf course is a land area that is 1760 yds by 2650 yds (you do not need to use all the land). A lovely creek (not a river) runs through the land, and there are trees on two edges, and a housing development on a third. You will need to have PAR information to do this, but these values are approximate, so you do have some leeway.
For the purpose of this activity, cost is no object, so trees and sand traps can be added at will.
Establish a scale: ___10___ yards = 1 cm is quite common
Draw a detailed sketch of your course using the paper by the meter sticks and hand in. Make sure you have added a compass rose and have marked the scale on your paper. Color the course using colored pencils or crayons.
Provide a vector length and heading for the first leg of each hole
Hints: Club houses are often 6000-15000 sq. ft. Houses are often 1800-4000 sq. ft., with the upper range representing a mansion-style home.If you choose to make a mini-golf course, you have an area that is 100 yds by 500 yds, and must include a clubhouse, a parking lot, 9 holes of golf, and a snack shop On one side of the course must be a go-kart course.
Hint: Google 'golf course design' if you need a sample to get ideas.
Step 2 :
Each person in your group will make a scale drawing of one hole, using a scale of 3 cm = 120 yards, in Google Presentation, Open Office Presents, or Power Point. The scale drawing will be done digitally using Power Point, but three copies of the hole must be handed in. Label the drawing with a hole number, mark the tee with a T, and the hole in a flag. Make sure the compass rose on this drawing matches the orientation of the hole on t he master course. The master course must also be handed in.
Thursday, September 20, 2012
9/20-9/24 Worktime
1. Check your answers to the 6 book problems you completed with mapowell.
2. Using your data on the graphs, mark where the car came off the ramp and why you believe that. Take the v(i) at that point ____m/s, and determine the interval of time where your car is traveling at a pretty constant speed ____s. Why doesn't the car travel at a constant speed forever? Explain.
3. Using your data and the video, determine the acceleration down the ramp. Identify the d, v(i), v(f), t, associated with this value that you calculated.
4. Why is it important to keep the camera still while recording a video for physics?
5. How far did your edible car travel, and how could you improve it next time. Be specific.
(Steps 3-5 must be done INDIVIDUALLY. Your group will hand in the graphs and INDIVIDUAL summaries as a group.)
============READ============
Start at http://www.physicsclassroom.com/Class/newtlaws/u2l1a.cfm and go through the two lessons on:
Friday, September 14, 2012
9/14
Task 1: You need to form groups of 2 to 3 This will be your team for the project.

Task 2: Logger Pro and the world of motion. Use a ramp and a cart to create a series of d-t and v-t graphs. For each, you need to print the screen (one copy PER group), and then highlight 4 evenly-spaced time points on the v-t and d-t graphs. For these, you will note the individual distances, velocities and times using the data chart to the right. The setups include:
- a motion detector at the top of a ramp, and a cart traveling down
- a motion detector at the bottom of a ramp and a cart traveling towards (but not hitting) the motion detector
- a motion detector attached to the ceiling and someone creating a vertical jump by standing, crouching, jumping, and then standing again
- a motion detector that is at the top of a ramp and a cart that is pushed up from the bottom, and then allowed to fall again.
Task 4: Copy the motion formulas on a notecard to be placed into your calculator or binder. Complete 7 of the 12 problems assigned by the teacher on pp. 82-83 (2, 35, 8, 9, 10, 11, 12, 14, 16, 17, 18)
d = v(i)t + 1/2at^2
d = t * [v(i) + v(f)] /2
v(f) = v(i) + at
v(f)^2 = v(i)^2 + 2ad
Thursday, September 13, 2012
9/14 analysis of movies
Watch the movies your classmaites have created. You must summarize each of them in a sentences or two in your notes, noting who made the movie and what it was about.
Now, we will analyze your movie and another group's movie.
1. Watch the movie. If you were to tape a ruler to the screen, could you track the motion as a type of dot diagram across the screen.
2. Was a left motion visible? What type was it?
3. Was a right motion visible? What type was it?
4. Was an acceleration visible? What type was it?
Open up Logger Pro and insert the movie that you believe was the best representation of the dot diagrams we did physics.
Logger pro will allow you to do a motion analysis. Follow the directions given in class to chart the left motion, the right motion,and the acceleration. Print the d-t and v-t graphs for each one.
9/10-9/12 Stop Motion Animation
Student are working with d-t, v-t, and a-t graphs, as well as formula representations and identifications of variables.
Students also will create a stop motion animation that shows a movement to the left at constant speed, a movement to the right at constant speed, and an acceleration of sometype. The animation must have 30 frames or greater.
The pictures should be sewn together using Windows Live Movie Maker and rendered, with a final copy being presented to Mrs. Powell.
Finished movies are found here
9/2 -9/5
Activities done during this point include
- Walk this way activity to translate personal motion into graphs
- Logger pro work
- Analysis of d-t and v-t graphs
- Homework focused on this translation
We missed Labor Day and another day this week for classtime, along with 2 early outs.
Monday, August 27, 2012
Aug 28 and 29
I. Creating acceleration graphs. Until this point, we have only moved at a constant speed. But that's not how the world always works.
Use a board (found between the two 4-drawer filing cabinet) that is place on a book or two to create a ramp. DO NOT MAKE THE RAMP VERY STEEP. Use a non-motorized car (they are green, and found in the far right hand cupboard by the window), and a logger pro to create four d-t and v-t graphs
Trial 1: Place the logger pro at the top of the ramp. Let go of the car so it rolls down.
Trial 2: Place the logger pro at the bottom of the ramp. Place the car at the top of the ramp and let it roll down towards the logger pro.
Trial 3: Place the logger pro at the top of the ramp. Place the car at the bottom of the ramp. Give it a sharp push so it rolls up and down the ramp.
Trial 4: Place the logger pro at the bottom of the ramp. Place the car at the bottom of the ramp. Give it a sharp push so it rolls up and down the ramp.
Print each of the 4 trials. Each printed sheet should have a d-t and a v-t graph.
II. Be ready to explain the difference between speed and velocity by reading the Physics Classroom The animations and problems on this page are really helpful, and should help increase your understanding.
III. Check your understanding of the first 4 trials by thinking about what is happening to the velocity in each case (the acceleration is always a negative value of 10, which is considered to be caused by gravity). Use this applet or the motion man applet to check your answers
IV. Finish the packet. At this point, you should be able to do that with ease.
Thursday, August 23, 2012
Aug 24: Motion Graphs with Moving Man
This activity is done in groups of 2 or 3. If there are more than three names on a sheet, it WILL NOT be accepted. This is a continuation of the graphing of this week, and yes, you've been patient. I realize it may be getting annoying. Bear with me, please?
| Click to Run |
Click on the activity above. It will eventually launch a new Java script in a separate window. If you are having trouble, Ryan can help. DO NOT click on the icon repeatedly or you will open up multiple copies of the program.
Print the Moving Man Activity for your group. This will be handed in, along with your packet at the end of the class period today.
Moving Man Activity
NOTES and PROCESSING
For the following situations, sketch a d-t, v-t, and non-zero a-t graphs that show up in your notes (this activity is modified from here). When you get done with the graphs, send me a picture for your group
A) A man moving from the left of the screen (-8 m) to the house (8m)
at a constant 2 m/s (adjust the v-slider).
B) A man moving from 0 to the house at a faster pace than above.
C) A man standing still at 4 m.
D) A man moving from 0 to the house at a fast pace then moving back to 0 at a slower pace (slide the man manually).
E) A man moving from 16 m to the tree m at a fast pace of (3 m/s).
F) A man moving from 0 to the house, speeding up as he walks (an acceleration of 1 m/s/s).
G) The man stands still while he talks on his cell phone at the middle of the sidewalk, then walks toward the house at a constant rate trying to get better cell reception. He comes to a sudden stop when the coverage is good (about a meter before the house) and stands still to finish his conversation.
H) The man starts close to the tree, stands still for a little while, then walks toward the house at a constant rate for a while, then slows gradually to a stop.
I) A man wakes up from his nap under the tree and speeds up toward the house. He stops because he is worried that he dropped his keys. He stands still as he searches his pockets for his keys. Once he finds them, he continues calmly to walk toward the house and then slows to a stop as he nears the door.
Monday, August 20, 2012
Aug 20
I. Today we will be looking at the data and trendlines, and the linearization of data.
In other words, how can we manipulate data to get a straight line using Excel?
You and two other people need to read up on this idea.

Discuss linearizing data II. From there, we will be starting to look at data collection using the dot method. You will need to pick up a packet and complete WS1
Discuss linearizing data II. From there, we will be starting to look at data collection using the dot method. You will need to pick up a packet and complete WS1
Friday, August 17, 2012
Aug 17
Today we will be analyzing data.
Step 1: Open up an excel spreadsheet and enter your data into columns. Make sure the labels (like inches or centimeters) are in the top column.
We will be making a series of x-y scattergraphs.
Circumference vs. Diameter
Diameter vs. Circumference
Diameter Squared vs Circumference
Circumference Squared vs Diameter
Step 2: Experiment with making the Charts
Step 3: Experiment with a best fit line
Step 4: Upload to Google Docs
Aug 16
Welcome to Science Interactions! I'm so glad you're here. Today's goals:
- Expectations
- Logging onto Google
- Your First Email
Ways to reach me:
Skype: marcia_powell
Cell: fivesixthree-six0eight-nineteenhundred
Email: marciapowellATw-delaware.k12.ia.us
Twitter: @mapowell
::mapowell::
Tuesday, May 15, 2012
The Final Project: Putting Physics to Use
View Larger Map
Goal: Take a position about the safety or non-safety of the intersection of Prospect, Sherman, and the faculty parking lot. Support with evidence, calculations, and models.
I. Model the setting using an acceptable scale. Model will be graded on accuracy, quality and usability for the presentation.
II. Model sample situations that can happen at the intersection, including:
a. a situation that will have 2d momentum and a collision
b. a situation that will force a driver to stop suddenly when an obstacle appears in the pathway
c. a comparison of the same car driving the same location at different speeds.
d. a problem that deals with net force, mu, or stopping distances under different weather conditions.
e. solve each of the situations in a-d, showing all work
III. Recommendations for the area of interest, including
a. dimensions
b. anticipated costs
c. rationale
IV. Presentation that explains recommendations and models the most likely sample situations. This presentation must include the scale model and will be video-taped. Creation of interest is critical.
Monday, May 14, 2012
Friday, May 11, 2012
Monday, May 7, 2012
Projectile Motion Reading
The last unit is really a throw-back to a previous unit....kinematics. During this first week, we will be looking at x-velocities and y-velocities, so you will need to find those 4 kinematic equations and realize that a(gravity) here on earth is about 10 m/s/s.
We'll start with a concept review. Go through the notes found at6
Physics Classroom
(there are 6 sections).
Show me your notes when you are finished.
After that, let's think about the easiest application of all for projectiles: catapults! These monsters are fun to make, but we are interested in physics, not just mayhem. So, for the point of this class the catapult must be capable of flinging either:
We will build these tomorrow after the quiz, so you MUST bring materials to work on.
http://www.chicagotribune.com/features/sns-diy-kids-crafts-catapult,0,1489370.story
http://www.stormthecastle.com/catapult/how-to-build-a-catapult.htm
http://revision3.com/joegenius/projectiles/homemade-catapults
http://www.youtube.com/watch?v=bY43tGhUSJY
http://www.youtube.com/watch?v=mlGDJZzPRRU&feature=related
http://jimmythejock.hubpages.com/hub/thejockspot_how_to_build_a_catapult
We'll start with a concept review. Go through the notes found at6
Physics Classroom
(there are 6 sections).
Show me your notes when you are finished.
After that, let's think about the easiest application of all for projectiles: catapults! These monsters are fun to make, but we are interested in physics, not just mayhem. So, for the point of this class the catapult must be capable of flinging either:
- a marshmallow
- a mini candy bar
- a dry package of ramen noodles
and hitting a target that is 3-4 meters (that's 10-13 feet) away. You will be judged on the ACCURACY of your catapult.
http://www.chicagotribune.com/features/sns-diy-kids-crafts-catapult,0,1489370.story
http://www.stormthecastle.com/catapult/how-to-build-a-catapult.htm
http://revision3.com/joegenius/projectiles/homemade-catapults
http://www.youtube.com/watch?v=bY43tGhUSJY
http://www.youtube.com/watch?v=mlGDJZzPRRU&feature=related
http://jimmythejock.hubpages.com/hub/thejockspot_how_to_build_a_catapult
Friday, May 4, 2012
Evaluating a Crash Scene

http://www.edheads.org/activities/crash_scene/swf/index.htm
You will have one hour to complete as much of the investigation as possible.
Thursday, May 3, 2012
Evaluation of Pool Table
Group Peer Evaluation (to be done in class)
Personal Evaluation (based on data, done alone)
WS1, WS2, WS3 answers (posted at 3 on 5/3/2012)
WS4
Test on Tuesday, 5/8/2012
Friday, April 27, 2012
Pool table documentation and video scripts
HAND IN YOUR PACKETS.
Use your phone or a flip video to make the videos. You may need to convert them, so use a video converter.
You will need to upload each of these items to your Google Docs account. Make sure it is in an .avi or .wmv (Windows Live Movie Maker) format and is less than 50 mb.
1. Make a 30-60 second video that shows you and your pool table, it's dimensions, and it's gravity feed system. Take a picture from above showing the break of the balls.
2. Create a one ball collision with a bumper using a video feed.
4. Create a two ball video between the ball and a second ball that illustrates 1-d momentum.
5. Create a two ball video between the ball and a second ball that illustrates 2-d momentum.
6. Create a two ball video between the ball and the second ball that causes both balls to rebound.
6. Analyze #3-6 using logger pro and the movie feature. Make certain you scale your picture.
7. Print your data.
Analysis will happen Monday and Tuesday.
You must share videos to marciarpowellATgmailDOTcom with your group member names.
Monday, April 23, 2012
Momentum Physics Pool Tables
This activity is adapted from High Tech High
You will be building a table top pool table.
Requirements
The Detailed Sketch must:
-- Be scaled-down from a full size pool table
-- Be no bigger than 65 cm * 130 cm
-- Be drawn on the computer (I would suggest Google Sketch)
-- Represent the ball return system that is gravity fed (not simply pockets)
The Pool Table must:
-- Include handmade billiard balls (golf balls allowed), cue sticks, & racking triangle
-- Be functional
The Ball Return System must:
-- Gather ALL the billiard balls in one area
-- Be easily accessible by the players
-- Be seamlessly integrated with the pool table
Step one: Make a materials list (cardboard is marginally useful, plywood is better), assign roles, and create a sketch of your design (please submit the sketch to me via email)
Step two: Create your pool table by Monday, 12/16 and bring to class
Step three: Notes and Ideas
Momentum ideas
Friday, April 20, 2012
Using Google Sketchup
We will be using Google Sketchup for a project this next week. As a result, you will be getting into pairs of TWO to learn how to use the program.
Go to the Google Sketchup YouTube Channel
Work through the Getting Started Tutorials. For each, save the final document you make as you go along with the video. Upload this sketchup file to your Google files and share with me. Since you are making a different project then all the others in this room, no two files will be alike.
Friday....It's a Google Day.
Wednesday, April 18, 2012
Concepts of Momentum

Tuesday, April 17, 2012
Bungie Barbie
Procedures:
Produce as least 4 different graphs by dropping Barbie with different cords. Use the evidence to collect a rationale for the common use of rubber as a bungie cord, and whether it is supported by your data.
Sketch, describe, print or save your graphs for each "jump". Clearly indicate which cord or material was used. Also include information such as the amount of force and the time over which the force was applied. Record any relevant observations you saw during the jump.
Individual WRITEUP (5 to 8 paragraphs, plus tables)
Would you rate the
Describe the ideal harness for a bungie jumper so that net force is distributed across the barbie. This should be based on data you gathered when Barbie parachuted.
Explain how the net time for the Barbie to stop jumping can affect a force distribution. (Think carefully: F=ma, but a = change in velocity/change in time)
Based on your data, is it possible to argue that there is a better material for a bungie jump than rubber? Why or why not?
What questions arose in the lab? What information have you found?
Monday, April 16, 2012
Understanding Newton's Laws' Poster
Your first goal today is to create a poster that show your understanding of Newton's Three Laws, using the Barbie examples we have done so far (weighing Barbie, making Barbie a seatbelt, making a Barbie car bumper, and watching Barbie parachute) to illustrate your point.
Content to be covered includes:
Content to be covered includes:
- a example of balanced forces
- a example of unbalanced forces
- an explanation of inertia and how that is related to safety features
- an explanation of the difference between mass and weight
- an example of net forces
- a formula on one of the diagrams that shows the net vertical forces
- a formula on one of the diagrams that shows the net horizontal forces
- Newton's first, second, and third laws, defined in YOUR own words (not science-babble) and not those of anyone else in the room
The MINIMUM requirement for your poster is a diagram of each of the four Barbie simulations and labeled forces and laws. This is an individual poster and due on Tuesday.
Secondly, you must hand in WS1/WS2 on the elevator and vertical net force problems.
Tomorrow and Wednesday we will be working with Bungee Barbie. Thursday will be a quiz and the start of the next unit.
Wednesday, April 11, 2012
Parachute Drop Barbie
Today you will need to complete the Barbie parachute jump three times today.
Measure the time it takes to drop the Barbie to the ground three times, using a stopwatch.
Using a force probe that is connected to a Logger pro, measure the Force weight of the Barbie and chute.
Divide by 9.8 m/s/s to get Barbie and chute's mass in kg.
Take a picture of the Barbie, in its harness, AND a picture of the parachute and harness system. Txt or email it to me, with your group member names
Reflection
Measure the time it takes to drop the Barbie to the ground three times, using a stopwatch.
Using a force probe that is connected to a Logger pro, measure the Force weight of the Barbie and chute.
Divide by 9.8 m/s/s to get Barbie and chute's mass in kg.
Take a picture of the Barbie, in its harness, AND a picture of the parachute and harness system. Txt or email it to me, with your group member names
Reflection
Monday, April 2, 2012
BUMPER CRASH BARBIE
Today, the teacher cadets will set up a Logger Pro system with two probes: the force probe (to get the weight of Barbie, the car, and each individual bumper), an accelerometer,

Weigh the Barbie, her seat, and the car with its bumpers.
Attach an accelerometer to the Barbie car, with the arrow pointed in the direction of the wall.
Determine mu of your vehicle on the floor. (Hint: we did this yesterday)
Use a kinematic formula (those acceleration formulas) to determine what you think the acceleration should have been when it came off the ramp.
Have your teacher cadet print the graph, and then save the file to the desktop with your group member names.
Draw a free-body diagram show all the forces on the level, including the net direction.
Use your data to figure out which bumper is most effective, and why you believe it to be so.
Repeat with the second bumper.
Take a picture of your seatbelt configuration for Barbie and detail why you think it is worthwhile. Leave the Barbie/seat on the back counter by my desk for Wednesday. Make sure you write your name on the Barbie/seat.
Compile all your information, pictures, and observations into a google document and share with me. We'll use the graphing data tomorrow.
Friday, March 30, 2012
Net Forces with Barbie
This unit focuses on the idea of Barbie as she travels through her daily life, experiencing net forces. Our goal is to keep her as safe as possible.
http://www.physicsclassroom.com/Class/newtlaws/u2l3b.cfm

Friday and Monday!
Task 1: Designing a bumper for Barbie (this will be tested on Tuesday, 4/3)
Task 2: The physics of seatbelts (you must design a seat and a harness with 3, 4, or 5 points of security for Wednesday)
Task 3: Determining mu and mu reflection
Task 3: Barbie's parachute
Task 4: Bungie jumping!
http://www.physicsclassroom.com/Class/newtlaws/u2l3b.cfm
Friday and Monday!
Task 1: Designing a bumper for Barbie (this will be tested on Tuesday, 4/3)
Task 2: The physics of seatbelts (you must design a seat and a harness with 3, 4, or 5 points of security for Wednesday)
Task 3: Determining mu and mu reflection
Task 3: Barbie's parachute
Task 4: Bungie jumping!
Wednesday, March 28, 2012
Thursday, March 22, 2012
Bridge Project on Statics
Go to http://bridgecontest.usma.edu/ and download the software. Run the install program and decide on your bridge.
Your goal for day one is to get a working bridge, and then minimize costs.
You will receive points for
Your goal for day one is to get a working bridge, and then minimize costs.
You will receive points for
- the weight your bridge can hold
- the design cost of your bridge
- the aesthetics of your bridge design and its build
- the agreement in design size between your bridge and your model
When you get a working design, you will need to minimize the costs. When you think you are done, call me over, and send me a copy of the design file.
Building the model:
You may use straws (a hollow core structure) or a bamboo skewer model.
Build the bridge at a scale that is .5 m = 1 cm. Both sides will need building, as well as one crosspiece of cardboard and a bottom of sticks
PRE BRIDGE REFLECTION
MODEL PROGRAM REFLECTION
PRE BRIDGE REFLECTION
MODEL PROGRAM REFLECTION
Monday, March 19, 2012
Thursday, March 15, 2012
Newton, and the Concept of Force
Finishing up Q3
GPS discussion (I'll be calling you)
Quiz 1, #2, #3, Worksheet 2

Create an outline or motion map for the each of the sections found in these two lessons. The creation takes the place of notes, so yes, you must EACH do this.
Newton's Law Lesson 1
Newton's Law Lesson 2
Application: Using what you have learned about vectors, and vector components, as well as the 8 subtopics described in the two lessons above, concentrate on ONE of the sports below and tell me how the sport is connected to the concepts in a poster format.
Baseball
Skateboarding
Racing
GPS discussion (I'll be calling you)
Quiz 1, #2, #3, Worksheet 2
Create an outline or motion map for the each of the sections found in these two lessons. The creation takes the place of notes, so yes, you must EACH do this.
Newton's Law Lesson 1
Newton's Law Lesson 2
Application: Using what you have learned about vectors, and vector components, as well as the 8 subtopics described in the two lessons above, concentrate on ONE of the sports below and tell me how the sport is connected to the concepts in a poster format.
Baseball
Skateboarding
Racing
Monday, March 12, 2012
Vector Benchmark
Project:
A. Explain to me, using a hand-drawn picture, how GPS works.
B. Use Google Maps/Google Earth and find the exact location of five landmarks in the West Delaware District. Create a series of vector representations that tell me how far each landmark is from the old front door of the school. List the starting GPS coordinate, the final GPS coordinate, the path length/degrees, and the two legs.
C. Check into these location, as well as the school using a GPS receiver or a smartphone software tool. If you choose to use the GPS, you will need to geocache the trip.
Common smartphone tools:
- Facebook checkin (you would need to friend me)
- Foursquare (again, friend me)
- Mapmyride.com
Turn in your completed project by Thursday. Groups larger than 3 will not be accepted.
Friday, March 9, 2012
Google Earth Trip
Your goal is to take a 6 stop trip around the world, starting and ending someplace in the West Delaware school district. Along the way, scrapbook, in some way, the important landmarks you find.
Use the path feature of Google earth to help you determine the vector for each, and separate into component legs. This form will be helpful.
When we get done, we will write a reflection on what you've found out. Expect this at the beginning of the class on Tuesday.
Grading is highlighted by the checklist found here
Thursday, March 1, 2012
Golf Course Intro to Vectors
Step 1: You, along with one or other designers , will be putting together a 9-hole golf course. The maximum area available for the golf course is a land area that is 1760 yds by 2650 yds (you do not need to use all the land). A lovely creek (not a river) runs through the land, and there are trees on two edges, and a housing development on a third. You will need to have PAR information to do this, but these values are approximate, so you do have some leeway.
For the purpose of this activity, cost is no object, so trees and sand traps can be added at will.
Establish a scale: ___10___ yards = 1 cm is quite common
Draw a detailed sketch of your course using the paper by the meter sticks and hand in. Make sure you have added a compass rose and have marked the scale on your paper. Color the course using colored pencils or crayons.
Provide a vector length and heading for the first leg of each hole
Hints: Club houses are often 6000-15000 sq. ft. Houses are often 1800-4000 sq. ft., with the upper range representing a mansion-style home.If you choose to make a mini-golf course, you have an area that is 100 yds by 500 yds, and must include a clubhouse, a parking lot, 9 holes of golf, and a snack shop On one side of the course must be a go-kart course.
Hint: Google 'golf course design' if you need a sample to get ideas.
Step 2 :
Each person in your group will make a scale drawing of one hole, using a scale of 3 cm = 120 yards, in Google Presentation, Open Office Presents, or Power Point. The scale drawing will be done digitally using Power Point, but three copies of the hole must be handed in. Label the drawing with a hole number, mark the tee with a T, and the hole in a flag. Make sure the compass rose on this drawing matches the orientation of the hole on t he master course. The master course must also be handed in.
Tuesday, February 28, 2012
Edible Race Cars.

Take a Logger Pro trial of the car as it travels down the ramp. Save the .cmbl file and upload to your Google Docs/share.
Autoscale the Logger Pro data and print off the graph. Mark an A point and the B point to show the start of the acceleration and a point near the bottom of the ramp. Print this graph.
Calculate/show the following:
- distance from A to B
- time elapsed
- v(i)
- v(f)
- a(ramp)
Now, determine a way (using your video) to find the a(deceleration) of the floor surface. One way is to open the video using Windows Live Movie Maker, which gives you a frame-by-frame analysis. Detail your method.
Answer the following questions INDIVIDUALLY.
a) what process did you use to decide on what type of a car to build?
b) what did you have to overcome to get the wheels to spin?
c) was your car able to travel a consistent distance? How do you know?
d) what would you do differently if you built the car again?
e) was the wheel design or the body design more critical. Explain.
f) how many data trials did you conduct? How confident are you that your video was a reliable representation of what your car could do?
If you were to draw a d-t graph for the entire interval of motion, what would it look like?
Tuesday, February 21, 2012
Using the Graphs to Find Equations
Today, we'll take a look at how those graphs we've been using work into the kinematic equations. It's a process that uses area and slope and replaces the graph model with a formulaic mathematical model.
WS 1-4 must be done at the the beginning of class tomorrow.
===============
 Determining your vertical jump rate using the data from Logger Pro.
Yesterday, we all took the time to do a vertical jump. Your goal is to calculate your rate of deceleration as you went up and the rate of acceleration as you went back down.
For the jump, use the data points at the bottom of the jump and the top to determine v(f), distance vertical, and elapsed time. Calculate your v(i) and your acceleration, based on this assumption. Show work.
For the acceleration rate back down use your v(f) at the top of the jump, the distance vertical, and the elapsed time. Calculate your v(f) at the instant before you hit the ground, and your acceleration, based on these assumptions. Show work.
WS 1-4 must be done at the the beginning of class tomorrow.
===============
Yesterday, we all took the time to do a vertical jump. Your goal is to calculate your rate of deceleration as you went up and the rate of acceleration as you went back down.
For the jump, use the data points at the bottom of the jump and the top to determine v(f), distance vertical, and elapsed time. Calculate your v(i) and your acceleration, based on this assumption. Show work.
For the acceleration rate back down use your v(f) at the top of the jump, the distance vertical, and the elapsed time. Calculate your v(f) at the instant before you hit the ground, and your acceleration, based on these assumptions. Show work.
Friday, February 17, 2012
Friday, 2/17/2012
Today we made notecards to talk about the 4 types of patterns available in a curved graph. If you've been gone, we should sit down and do this together.
We discussed the rest of WS1, including #4 and #5, via discussion
We completed WS2a and compared qualitative and quantitative graphs
WS3 was assigned for homework.
Thursday, February 16, 2012
Using d-t, v-t, and a-t graphs
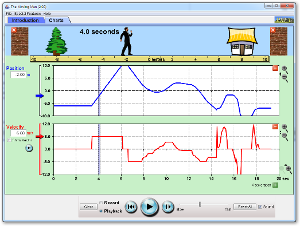
Today we'll be starting with a motion detector and the Logger Pro. Complete the d-t graph and the v-t graph for each of the three scenarios presented.
Then, head to the Moving Man Simulation found at PHET by clicking the link below:
CLICK ON THE CHARTS TAB
The graphs in simulation should mimic what you have in logger pro, but with one difference: the a-t graph is valid. Logger pro is not good at generating a-t graphs using a motion detector. Discussion questions to consider include:
Then, head to the Moving Man Simulation found at PHET by clicking the link below:
| Click to Run |
CLICK ON THE CHARTS TAB
- For trial 1, enter in the following values: x=0, v=0, a = +1
- For trial 2, enter in the following values: x=0, v=0, a = -1
- For trial 3, enter in the following values: x=0. v=0, a = -1
The graphs in simulation should mimic what you have in logger pro, but with one difference: the a-t graph is valid. Logger pro is not good at generating a-t graphs using a motion detector. Discussion questions to consider include:
- What would a dot diagram look like for each of the situations? Be sure to mark zero.
- Are you able to calculate the slope of the d-t or v-t graphs? Why or why not?
- What's the difference between a slope of an interval and a slope of an instant?
- How could you calculate the slope of an instant? Explain.
- What does the area under a v-t or a-t graph tell you? Explain?
Monday, February 13, 2012
Angry Birds Analysis

And that's also what we created when we took the Jing videos, and then took equal interval snapshots. Your task today is to pick an three objects and track them from shot to shot, creating a dot diagram for the vertical and horizontal motion of each. This will give you a total of 6 ten-dot diagrams. IF the objects are no longer visible, then you will need to define the assumption.
Your 6 graphs will need to be created in Google Docs and shared. When you finish, you will need to answer the reflection questions below and place into the form.
Tuesday, February 7, 2012
Week of 2/6 to 2/10
Well, this is a busy week. We've got parent-teacher conferences, a day off, and lots of physics to do. Shortened classes mean that we've got to get to work.
Your goals:
And get ready to take a quiz on Friday or Monday. Ready, set, go!
Your goals:
- Be able to go from d-t to v-t graphs and vice versa.
- Develop models that are mathematical for d-t and v-t graphs.
- Collect data on motion by playing fruit ninja or angry birds.
- Analyze that data using a .swf collected from JING.
And get ready to take a quiz on Friday or Monday. Ready, set, go!
Friday, February 3, 2012
Wednesday, February 1, 2012
Tuesday, January 24, 2012
Group Commercial (2 or 3 people max) DUE FRIDAY at beginning of class
Your goal will be two-fold.
First, synthesize the information from yesterday in some digital format and share it with me. I will need at least 2 points or sentences for each one of the topics. Additionally, add any information your find about the topic below to your digital document, including your RESOURCES.
Secondly, create a video public service announcement that tells the class about one of the following. I would prefer you spread out across all the topics, rather than several people doing the same thing.
- Irradiation of spices using cobalt-60
- Cs-133 atomic clock uses
- Iodine-131 uses
- Americium-241 for gauging plastic
- Americium-241 smoke detectors
- CT vs. PETscans using C-11, N-13, or O-15
- Uses of Technicium-99m
- Fresh food irradiation using cobalt-60 to kill ecoli or other bacteria.
The following information must be present in your video clip:
a. What type of decay is going on?
b. What is the half-life of the object, and how long will it take for 99% to disappear
c. How can we protect humans from this type of isotope when we don't want to be exposed to it?
d. Are quarks involved in this process?
e. Is this process used currently?
f. How is the technology like a particle detector. Pick two similarities and two differences.
g. Why is radioactivity all around us? And what's the difference between radioactivity and antimatter.
Upload your video to a youtube account and share with me.
Grading Rubric
Content correctness: 10 points
Entertainment value: 10 points
Use of media to enhance presentation: 5 points
Involvement by all members of group: 5 points
Title or Credits, as appropriate: 5 points.
Text or tweet me with questions.
Day 10: Where Now?
We still haven't figured out the mechanism of a beta decay. Why is it that an ELECTRON would fly out of the nucleus? The answer involves quarks.
A quark is found inside of protons or neutrons. When a quark becomes unstable, a neutron can turn into a proton. To keep charges balanced, an electron also comes ripping out.

BUT YOU DON'T HAVE TO TAKE MY WORD FOR IT.... Instead, check out this website to find out about:
quarks
A quark is found inside of protons or neutrons. When a quark becomes unstable, a neutron can turn into a proton. To keep charges balanced, an electron also comes ripping out.
BUT YOU DON'T HAVE TO TAKE MY WORD FOR IT.... Instead, check out this website to find out about:
quarks
- the standard model
- antimatter
- particle detectors
- how particle detectors work
- how this benefits science
- how this benefits society
Gather all this information into a digital document (a Linoit or Google Doc is suggested) and include any questions you still have.
Subscribe to:
Posts (Atom)