Wednesday, May 21, 2014
Final Activity
TOMORROW (THURSDAY) WILL HAVE A FOLLOW UP SURVEY WORTH 20 POINTS. PEOPLE WHO ARE GOING TO BE GONE STILL NEED TO TAKE IT.--REMEMBER!!!)
At this point, almost everyone is wondering to themselves
"What does this radioactivity stuff have to do with physics anyway?"
Great question.
Physics is the study of forces, energy and motion. There are four main forces in the universe, according to current theory
MACRO FORCES
Gravity (the weakest force)
Electromagnetism (aspects of which include all the forces we study in the rest of the class)
NUCLEAR FORCES
Weak force (also known as radioactivity)
Strong force (the holds together the pieces that make up protons and neutrons)
We've started out this class with a snippet of information about Nuclear Forces, and next week, we move on to Macro Forces for the rest of the course. Before we do that, two things need to be accomplished.
Part 1
Create a public service video about a radioactive application using one of the following isotopes. One common application of the isotope is shown in ( ). Here's a sample of a particularly fancy one, While yours does not have to be this fancy, information does matter.
Here are some sample isotopes you could use.
- (irradiation of spices)cobalt-60
- Cs-133 (atomic clock)
- Iodine-131
- Americium-241 (gauging plastic)
- Americium-241 (smoke detectors)
- (CT or PET scans ) C-11, N-13, or O-15
- Technicium-99m
- (Fresh food irradiation) cobalt-60
- Leakage from Fukoshima (caesium or cesium contaminated water)
- C-14 (radioactive dating)
- Some other isotope of your choice
The following information should be present in your background information:
a. What type of decay is going on (alpha, beta, gamma, or fission)?
b. What is the half-life of the isotope, and how long will it take for 99% to disappear
c. How can we protect humans from this type of isotope when we don't want to be exposed to it?
d. How are force or momentum used in this process?
e. How often does this process affect your life?
g. Why is radioactivity all around us? And what's the difference between natural radioactivity and deadly radioactivity.
Upload your video to a youtube account and share with me.
Grading Rubric
Background notes and content correctness: 10 points
Entertainment value: 10 points
Use of media to enhance presentation: 10 points
Involvement by all members of group: 10 points
Title or Credits, as appropriate: 5 points
Part 2
Part 2
Work together to finish this worksheet, but you MUST hand in individual work.
Tuesday, May 20, 2014
Thursday, May 15, 2014
Monday, May 12, 2014
Beginning of Radioactivity--Picture notes.
FINDING OUT ABOUT THE NUCLEUS
Thomsen's Experiment
Rutherford's Model
Chadwick and Millikan
RADIATION AND PROBABILITY
The Basics
The Dosages and Such
Thomsen's Experiment
Rutherford's Model
Chadwick and Millikan
Watch the full episode. See more NOVA.
The Basics
The Dosages and Such
Friday, August 27, 2010
Modeling and Questions about Radioactivity
1. a) Using things available in the classroom, construct a model of the Rutherford experiment.
2.
a) Explain the difference between a detector and a probe.
b) Explain the difference in half life between two isotopes
c) Contrast fission and fusion.
d) How would you respond to an extremely obsessive person who wanted to avoid radiation at all costs.
Friday, May 9, 2014
Projectile motion model writeup
1. You built a catapult . Adjust it so that it is capable of launching a large marshmallow from a distance of 3 to 5 meters, and hitting a target that is .30 m high +/- .10 m. You will have 5 trials to hit your target at each distance on Friday, and will be graded according to your accuracy. (10 points)
2. Determine the variables for the y(down) and x for your catapult. Base your calculation on d(y) and x(y), both which were measured. SHOW WORK. (15 points)
3. Where is the biggest frictional issue in your machine? Explain why this matters to the range of your machine. (3 pts)
How could you determine F(net) of the projectile? (3 points)How will the net force of the projectile change if we use marshmallows instead of paper wads? An orange? Why?(3 points)
Explain how you would change the design if you built another machine, and what you have learned about projectiles. Include the following terms in your discussion about projectiles.: potential energy to kinetic energy changes, frictional force, net force, acceleration of gravity, vectors, kinematic equations, independent x and y motions. (15 points)
================================
Compare the physics engine used in your cartoon to the physics engine used in your game, using the data you captured in screen shots to support one of the following:
1. Both the cartoon and the game have great physics.
2. Neither the cartoon or the game have great physics.
3. One of the two is obviously superior.
This should be close to a page when done
================================
Use your paperwad data and see how close your value of C in the quadratic analysis came to -5 m/s/s
In fact, you can calculate the percentage error by using (x-5)/5, since the acceleration of gravity is 10 m/s/s.
Why does your data match or not match this idea?
Explain, using your screen shot as evidence.
Monday, May 5, 2014
Understanding projectile motion models
This project is focused on seeing how projectile motion is used in digital media as well as common experience. You must complete all projects, and put a screen shot of each data analysis in a shared Google folder.
Throughout this effort, you will need to use Vernier Logger Pro, the web cam, and/or http://www.screencast-o-matic.com/screen_recorder

Part 1: Take a video of your partner shooting a paper wad into the wastebasket. You must be at a right angle to the person so you can see the entire arc of the parabola. Analyze it using the Logger Pro. Fill out the 15 variable chart, indicating on the screen shot where you started and ended the parabola.
Part 2: Analyze the parabolic motion on a cartoon. This is a great opportunity to use screencast-o-matic and a youtube video in conjunction with video analysis. Again, fill out the fifteen variable chart.
Part 3: Build a catapult capable of CONSISTENTLY hitting a sheet of typing paper from a distance of 3-5 meters. You will calculate the range, v(i) in both directions, and maximum y-displacement. You will be graded on the number of hits in 6 trials.
Part 4: Analyze a video game physics engine to decide if the game is realistic or not. The game must be approved by me in advance.
Part 5: Go to http://phet.colorado.edu/en/simulation/projectile-motion and launch the applet. Provide evidence (screenshots) to answer the following questions:
1. How does air resistance change the path of a projectile?
2. Shoot a single projectile at the same speed, but at 20, 30, 60, 70 , and 80. Use this information in some way to determine the maximum range of a computer.
Friday, April 25, 2014
Guilty Until Proven Innocent
Problem:
How can you use the conservation of momentum to prove to a judge that you were not speeding and therefore do not deserve a ticket for the collision?
Materials:
Paper, Logger Pro, video, safercar.gov, protracter, ruler.
Procedure:
You leave the school teacher's parking lot and are traveling north when you are broadsided by a car traveling east. The collision occurs in a school zone with a speed limit of 20 mph. The impact throws you into the band practice field.

Research:
What type of a vehicle were you driving? What type of a vehicle was the other driver riding in? Look again at the safety and the mass of these vehicles at the NHSTA site (http://www.safercar.gov ). Use the same vehicle you looked up earlier this week.
Your vehicle_______________ Mass or weight____________
Their vehicle_______________ Mass or weight____________
Decide on the units for your momentum and record here ____________
Draw a diagram of the two cars just prior to impact. You were headed north, the other car was headed East. Choose a scale (e.g., 1 cm = kg m/s) or freehand draw a diagram of the vehicles before AND after the impact your calculation .
There are two possible cases. In Case 1, you were going 20 mph. In Case 2, they were going 20 mph. One things for sure. After the collision, you were stuck together and both of you traveled at 22 mph.
Do one set of calculations for each Case.
STEP 2: MODEL THIS COLLISION USING two balls of similar diameters but different masses. Because the collision described above is inelastic, the balls must stick together and slide after impact.
STEP 2: MODEL THIS COLLISION USING two balls of similar diameters but different masses. Because the collision described above is inelastic, the balls must stick together and slide after impact.
Summing Up (each person does this individually,1/2 to 1 page, and hands it in paper clipped to the diagrams)
1. Qualitatively explain, using your diagrams, how you know that you were not going faster than the adult. Remember that a ticket means higher insurance rates and a large fine.
2. Do you think you were you speeding?
3. How would angles affect your logic?
4. What evidence of impulse or guilt would the police collect in this action?
5. Based on the safety rating of the vehicles involved, what do you think the extent of the injuries would be?
6. What role did impulse play in the safety factors present in your vehicle?
5. Based on the safety rating of the vehicles involved, what do you think the extent of the injuries would be?
6. What role did impulse play in the safety factors present in your vehicle?
Wednesday, April 23, 2014
Momentum Actvity
Activity 1 http://www.physicsclassroom.com/class/momentum/Lesson-1/Momentum-and-Impulse-Connection (there are 7 problems, and you must do at least 4. SHOW WORK)
Activity 2 http://www.physicsclassroom.com/class/momentum/Lesson-2/Momentum-Conservation-in-Explosions (Do all 5 problems. SHOW WORK)
=======Second 45 minutes===========
Activity 3 should be downloaded to a computer and filled out. http://phet.colorado.edu/files/activities/3777/Solar%20System%20PhET%20momentum%20conservation.docx Do not kill a tree--simply write down the work to show your answers.
Hand in at the end of the hour. Each person should hand a sheet in.
Thursday, April 17, 2014
Pool Table work
Part 1
1. Determine mu of your pool table surface.#
2. Determine the elasticity of the bumper using p(b)=p(a) using logger pro and the Video Capture option.#
3. Make a drafting sketch of the pool table using autodesks, google sketchup, or a paper pencil model. It must be to scale.#
4. Practice making shots where the ball recoils at 90 degrees, where the ball recoils at 180 degrees, > 90 degrees, and the ball recoils at < 90 degrees. #

Part 2:
1. Use a cell phone or flip camera to document your expertise in #4. #
http://billiards.colostate.edu/threads/position.html
Part 3:
1. Hand in a scaled model of your pool table that includes top and side views. This may be done using graph paper, sketch-up, or a CAD program, but the final product must be digitized.
2. Create a Logger Pro artifact for the two collisions that includes the dot diagrams on the video and your calculations from Monday. The first one will use only the x-axis. The second one will use the cue-ball going off at a right angle. Send me a screen shot of these two videos after analysis
3. Hand in the analysis for the 1-d collision of the ball, showing me a) the momentum before the collision, b)the momentum after the collision, c) the net time the two objects were in contact, and d) calculations of the change in momentum and the impulse Force. This is most easily done using paper and pencil and then taking a picture of the finished project. (Hint: use the mass of the cue ball and the cue stick, or the mass of both of the balls)
4. A picture of your group and your pool table must be included.
Part 4:
Evaluate a pool table that is not your own from a different table cluster.
Wednesday, April 9, 2014
Net forces activity
Part 1: use the applet found at http://phet.colorado.edu/en/simulation/the-ramp
First, take a look at the page found here. http://phet.colorado.edu/en/contributions/view/3143 It has lots of labs, some good, some bad, that help people to figure out the basics of mu, horizontal force net, and forces on a ramp.
Pick one of these labs and go through it. Do not pick the same lab as another group at your table. TEAMS ABOVE THREE WILL NOT BE ACCEPTED. Turn it in today.
Part 2: to be done individually, on paper, while sharing the computer applet.
DESIGN TEST: Last Friday, we had a net force worksheet that we have not graded--yet. You will need to use this applet to help design a student lab that is not boring and easier to understand regarding net force on a hill. The lab should create understanding for mu on a hill, force body diagrams, and use net forces to answer the following question: Does the mass of an object change the mu of an object moving with net force along the ramp?.
State the purpose of your lab:
Give directions, as needed:
Collect evidence:
Tell me what is analyzed:
Part 2 is due on Friday.
Tuesday, April 8, 2014
Thursday, March 27, 2014
Bungie Barbie
Go to http://www.physicsclassroom.com/reviews/newtlaws/newtlawsprint.cfm 41, 42, 46, 50-56
=================
Links to consider
Parachute Basics
Air Resistance (NASA)
Parachute History (you may want to check out Historical Review)
EACH GROUP WILL NEED TO TURN IN A SET OF CALCULATIONS BASED ON THE INFORMATION BELOW.
=================
Links to consider
Parachute Basics
Air Resistance (NASA)
Parachute History (you may want to check out Historical Review)
EACH GROUP WILL NEED TO TURN IN A SET OF CALCULATIONS BASED ON THE INFORMATION BELOW.
Today you will need to complete the Barbie parachute jump three times today.
Measure the time it takes to drop the Barbie to the ground three times, using a stopwatch.
Using a force probe that is connected to a Logger pro, measure the Force weight of the Barbie and chute.
Divide by 9.8 m/s/s to get Barbie and chute's mass in kg.
Take a picture of the Barbie, in its harness, AND a picture of the parachute and harness system. Txt or email it to me, with your group member names
Class Prep: Measure the distance from the landing rail to the ground below
_____m
If we drop an object from the landing rail to the ground (assume no friction), we know the following:
v(i)=____m/s
a=____ m/s/s
d=____ m
What will be the time it takes for the object to land?
You will need to complete the Barbie parachute jump three times today.
1. Measure the time it takes to drop the Barbie to the ground three times, using a stopwatch. Calculate the average time ______s
2. Using a force probe that is connected to a Logger pro, measure the Force weight of the Barbie and chute.
3. Using a(g) = 9.8 m/s/s, determine the mass of Barbie/chute's ____ kg.
4. Now you have a slightly different system than the one we first considered. We know the distance to the ground d=___ m, the initial velocity v(i)=____m/s, and the time(avg) of the three trials _____s
5. Using the data in 4., calculate the net acceleration of your parachute.
6. Draw a force diagram of Barbie, the net force, the force weight, and the force up.
7. Determine F(up).
Take a picture of the Barbie, in its harness, AND a picture of the parachute and harness system. Email it to me, along with a picture or shared document of your calculations.
Reflection (to be done on Monday)
Monday, March 24, 2014
Wednesday, March 19, 2014
Bridge Reflection
Before you test your bridge out, please fill this
PRE_REFLECTION form out.
Test the bridge. You will need to place it between two stools. Place material on it, and start adding mass. You may use 100 g or 500 g masses.
Keep track of:
____mass of bridge (kg) Remember, 1000g = 1 kg
____mass added to the bridge (kg) Remember to stay out of the way of the masses. DO NOT stand under the bridge, or with your head below the bridge.
____weight of the bridge (N) Weight on Earth = mass(kg) X a(gravity). The acceleration of gravity on earth is about 10 m/s/s
____weight of the mass added to the bridge (N)
____ length of the bridge (cm)
Take a series of pictures of the bridge
a) before you start (your group members should all be in this picture)
b) when it has 1 kg of mass on it
c) when it has 2 kg of mass on it
d) when it has 5 kg of mass on it.
e) when it starts to torsion
f) after a bridge collapse
Use these pictures to help you with the reflection, and email me your favorite 3.
Then, fill out the FINAL REFLECTION
Monday, March 17, 2014
Monday
Make sure your two sides of the bridges are finished.
Go through the following screens. At the bottom of each, you must complete the 'Check Your Understanding' problems (and show work). These are due at the end of the hour.
We will assemble the bridges tomorrow.
http://www.physicsclassroom.com/class/newtlaws/Lesson-3/Newton-s-Second-Law (4 problems)
http://www.physicsclassroom.com/class/newtlaws/Lesson-3/The-Big-Misconception (summarize the misconception)
http://www.physicsclassroom.com/class/newtlaws/Lesson-3/Finding-Acceleration (2 problems)
http://www.physicsclassroom.com/class/newtlaws/Lesson-3/Finding-Individual-Forces (2 problems)
http://phet.colorado.edu/files/activities/3248/Newton's%20Laws%20and%20the%20Lunar%20Lander%20Sim.doc (answer as many of the questions as you can using this applet)
Friday, March 7, 2014
Static Forces
www.physicsclassroom.com/class/newtlaws/Lesson-1/Newton-s-First-Law
We'll be working with the first seven screens.
http://central.wmrhsd.org/FACULTY_FILES/jherrigel/Honors%20Physics/free%20body%20diagram%20worksheet.pdf
We'll be working with the first seven screens.
http://central.wmrhsd.org/FACULTY_FILES/jherrigel/Honors%20Physics/free%20body%20diagram%20worksheet.pdf
Tuesday, March 4, 2014
Vector Benchmark
This must be completed with someone from another table than your own.
Project:
INDIVIDUAL PART
Create a series of four scaled vector representations (with a rule and protractor) that tell me how far four buildings in the Manchester area are from the bell of the school using Google Earth. For each diagram, you must list the starting GPS coordinate to the nearest minute, the final GPS coordinate to the nearest minute, the path length/degrees, and the two legs. Show work, including a scale where 1 cm = ______ .
GROUP PART
Use your understanding of GPS and/or Vectors to explain how one of the topics below work, it's advantages, disadvantages, and if your group would recommend it.
Include a sample physics problem associated with this topic, concrete examples and graphics as appropriate, along with a Resource sheet
You may choose something else, but here are topics to consider:
- How 4Square and Facebook check-in work. Advantages and disadvantages. (I'd suggest checking in at least 10 places in the Mantown area if you do this. Use Google Earth to find the exact latitude and longitude)
- Developing a Geocaching Hunt (Brrr...if you do this, it will be cold. Make a hunt, but then explain exactly HOW you did it. If you have an app to do that, explain it.)
- Precision Agriculture (check out many of the online farm journals, or agleader.com, or other sites. Why do they have to sample the fields to use this technology? How accurate is it? Do you want to have tractors with auto-steering? Is this the future of farming?)
- Military Drone Targeting (Type in a location, and a remote control bomb can drop on a location half-way across the world. Human rights activists suggest that this technology is not as accurate as it should be, and many civilans have been harmed.)
- Discoveries using Google Earth (military secrets, shipwrecks and hidden treasure, and perhaps undiscovered archeological finds....all from your armchair. Where have these things been found? What is the GPS location of some of these secrets?)
- Using Vector-scaled technology in Powerpoint and Adobe Illustrator
- Problems and Foibles with your Automatic Navigator (at what point should you stop listening to the voice and use your common sense? What about the Apple Maps fiasco? Where do the maps used in these applications come from, anyway?)
- A GPS can be installed on cars to track a fleet, a rental car, or to check the habits of drivers in your family. Is this the future of insurance? Is it a benefit or an intrusion? How do these things work?)
- Navigation in Flight (What does it take to to be a aeroflight navigator, and how is it different than the Google Tours we just put together? How has GPS replaced sin, cos, and tan and the Pythagorean theorem needed by navigators of the mid-century last year?
- 3d printing is an application of vectors that can be used for a variety of purposes: DIY hands,
Grading:
Presentation (this can be a flipped video to show to the class or you can present)--15
Digitized artifacts (upload everything to a Google Drive folder, and then share with me)--15
Demonstrated Understandings in Physics related to vectors and/or GPS--15
Quality/Resources--15
Thursday, February 27, 2014
Google Tour
Google Earth Tours: http://www.google.com/earth/outreach/tutorials/kmltours.html
Your goal today is to create a Google Tour that is able to traverse the world. When you get done, you will share the .kml file with your instructor.
Google kml tours
Use the path feature of Google earth to help you determine the vector for each, and separate into component legs. This form will be helpful.
Tuesday, February 25, 2014
Map a Palooza
Use an Iowa map and draw ten vectors originating from the origin point of your choice.
For example, you might start at Slater and go to Primghar, then Slater to Ames, Slater to Centerville, etc. Draw on the map.
Although you are working as teams, you EACH must turn in a table and a reflection at the end of the period.
Use a protractor to measure the angle from a starting heading of zero degrees. You did this yesterday. To do this, make sure you draw a compass rose at your origin point. An angle of 133 degrees, then, would be headed towards the southeast corner of the state.
Make a table to share your data.
My Origin City:
Pick 3 of your vectors and break into N-S or E-W components. These vectors must break into triangles, so the degree heading cannot equal 0, 90, 180, or 270 degrees.
Reflect:
1. How useful is this information in determining the length of time for the trip? Be specific. The vector I drew is most useful to __________ because ____________. If I was using a different mode of transportation, such as_______________, I would rather have information like__________________
2. Make a claim about the driving distance between Manchester and Ames. Explain how you determined the distance using the paper map. Be specific as to route and vectors used.
3. On the back, we looked at an old-style measuring template that's like a reverse excel map. Does this map use a 'as the crow flies' strategy or something else? Explain your reasoning.
When you get done with this, hand in to Mrs. Weber.
Tomorrow, we will be working on a world trip, so make a list of 10 spots you would like to travel to in the world. They must all be on a theme of some sort and move beyond the US borders, at least eventually. Here are some themes people have used in the past.
For example, you might start at Slater and go to Primghar, then Slater to Ames, Slater to Centerville, etc. Draw on the map.
Although you are working as teams, you EACH must turn in a table and a reflection at the end of the period.
Use a protractor to measure the angle from a starting heading of zero degrees. You did this yesterday. To do this, make sure you draw a compass rose at your origin point. An angle of 133 degrees, then, would be headed towards the southeast corner of the state.
Make a table to share your data.
My Origin City:
| Destination City | Distance as the Crow Flies(mi) | Vector Heading in Degrees |
Pick 3 of your vectors and break into N-S or E-W components. These vectors must break into triangles, so the degree heading cannot equal 0, 90, 180, or 270 degrees.
Reflect:
1. How useful is this information in determining the length of time for the trip? Be specific. The vector I drew is most useful to __________ because ____________. If I was using a different mode of transportation, such as_______________, I would rather have information like__________________
2. Make a claim about the driving distance between Manchester and Ames. Explain how you determined the distance using the paper map. Be specific as to route and vectors used.
3. On the back, we looked at an old-style measuring template that's like a reverse excel map. Does this map use a 'as the crow flies' strategy or something else? Explain your reasoning.
When you get done with this, hand in to Mrs. Weber.
Tomorrow, we will be working on a world trip, so make a list of 10 spots you would like to travel to in the world. They must all be on a theme of some sort and move beyond the US borders, at least eventually. Here are some themes people have used in the past.
- places Dr. Who has visited on Earth
- world class symphonies
- world famous zoos
- places you can eat sushi
Now of course, you're more creative than that, so whatever your passions--the world's best burgers, the best art museums, or a retracing of the steps of Hemingway, you should be able to come up with 10 locations to visit by the time you and your partners arrive in class tomorrow.
Thursday, February 20, 2014
Golf Courses

Step 1: You, along with one or other designers , will be putting together a 9-hole golf course. The maximum area available for the golf course is a land area that is 1760 yds by 2650 yds (you do not need to use all the land). A lovely creek (not a river) runs through the land, and there are trees on two edges, and a housing development on a third. You will need to have PAR information to do this, but these values are approximate, so you do have some leeway.
For the purpose of this activity, cost is no object, so trees and sand traps can be added at will.
Establish a scale: ___10___ yards = 1 cm is quite common
Draw a detailed sketch of your course using the paper by the meter sticks and hand in. Make sure you have added a compass rose and have marked the scale on your paper. Color the course using colored pencils or crayons.
Provide a vector length and heading for the first leg of each hole
Hints: Club houses are often 6000-15000 sq. ft. Houses are often 1800-4000 sq. ft., with the upper range representing a mansion-style home.If you choose to make a mini-golf course, you have an area that is 100 yds by 500 yds, and must include a clubhouse, a parking lot, 9 holes of golf, and a snack shop On one side of the course must be a go-kart course.
Hint: Google 'golf course design' if you need a sample to get ideas.
Friday, February 14, 2014
Friday and Tuesday
By the end of the day today, you should have uploaded a video to your google drive and shared it with me. We are going to analyze the videos in a Round Robin fashion. That means that we will start with Lyndsey, Savannah, and Addison's group. Their video will be analyzed by the table with Mr. Gassman and Ms. Fischer. The video created at that table will be analyzed by Mr. Nolz's group, and so on. These videos will need to be analyzed and the reflection done by the beginning of class on Wednesday.
If you get stuck, the other assignment is the first five screens of information found in Lesson 1 at http://www.physicsclassroom.com/class/vectors This is meaty information. Read a paragraph and then ask yourself...what does that mean? If you have questions, write them down. This will be our topic on Wednesday as we start the new unit.
Have a good three day weekend!
Monday, February 10, 2014
Stop Motion Movie/ Video Analysis of Animated Motion
How good is it? That is that question videographers have to ask each day when they put together animations, whether it it something that is created in 3d (Blender or Maya), or even a stop motion movie.
|
| linked from http://capsicumsunset.files.wordpress.com/2008/09/wile_e_coyote-gravity-lessons.jpg |
In original animations, each picture was drawn on a cellulose or acetate sheet, and then a picture was taken of each. If you look at it frame by frame, you can see that sometimes the images were 'padded' or the same image was used twice in a film to cut down on work for the animators. We do this today with stop motion animation, an extension of the techniques that have been around since the claymation movies.
A History of Animation tells this story well. Animation single cells are now sold as collector pieces
In the past five years, this hand-animation has experienced a bit of a renaissance, with both Pixar and Disney doing some still work. It takes very simple tools.
Digital tweenings then started to take over, with wire-frame animation and user-friendly programs like Flash. These gave way to more robust programs with physics engines and 3D graphical modeling which have boosted the CGI and animation industries.
Your project is to look at the physics of motion in movie clips. You can do this in a variety of ways, but you will need to analyze what is created using Logger Pro. This includes segments on constant motion, on acceleration and deceleration, and vertical motion.
Possible options include
- making a stop motion movie
- comparing two types of animation
Print or save each of the the Logger Pro analyses, and email them to me, as well as any video products you create.
Grading Rubric is here
=========
Group Reflection (Presentation or Linoit) Using v(i), v(f), d, a, and t variables
1. How well did you or others animate this project? What specific evidence do you have to support your claim?
2. What are three things that could have been done better in this project to mimic reality? Again, show specific evidence.
3. Identify a .2 sec time interval. Identify the initial v(i), and the v(f). Calculate an acceleration in m/s/s and calculate the distance traveled. SHOW FORMULAS used.
4. Find a place where the y-velocity is decreasing for .1 seconds. Identify the v(i), the distance traveled, and calculate the acceleration in m/s/s. SHOW FORMULAS used.
5. Find a place where the x-velocity is relatively constant. Identify data and calculate the acceleration. How close does this data match to the assumption that acceleration should be zero? SHOW FORMULAS used.
6. Based on your work, and work done in class, which do you believe is the best type of animation: a) hand-drawn, b) stop-motion movement, c) computer-animated children's programs, d) computer-animated for motion picture movies. Explain this to me in 2 or more paragraphs, listing advantages and disadvantages of each.
More Kinematic Practice
Thursday, February 6, 2014
Your Vertical Jump
The basic directions for this lab are found here. Everyone will be working on gathering their own personal set of data. When you get done, please save the file to the desktop, and then share it to yourself and to me (marciaRpowellATgmailDOTcom or marciapowellATw-delawareDOTk12DOTiaDOTus). We will use this tomorrow
Tuesday, February 4, 2014
Edible Race Cars
Day 1: build and testing your edible race car
Day 2: You're working through the problems on the physics classroom (http://www.physicsclassroom.com/class/1DKin/Lesson-6/Kinematic-Equations ) There are 5 screens. Fill out the questions and problems as you go along
Day 2: You're working through the problems on the physics classroom (http://www.physicsclassroom.com/class/1DKin/Lesson-6/Kinematic-Equations ) There are 5 screens. Fill out the questions and problems as you go along
Wednesday, January 29, 2014
Fitness Tracks
Well, since it is wayyyyyy to cold to use Map My Run, we'll need to use the school to develop fitness routes for winter.
Our data
Class assumptions
Design your basic, intermediate, and aerobic routes. Remember, all our measurements are in meters, so you must convert English measurements to metric. (15)
Create a drawing of each route, along with the number of laps Your final drawing should be understandable to people who come in from the community to walk in the morning or after school. (15)
Determine the time for one lap, based on your fitness data. Also determine the total time it will take to complete. (18) SHOW WORK.
If you are over or under in measurements by 100 laps, you may stop.
============Final Turn IN===============
Hand in all of your rough draft work.
Draw each of your maps on this school map Use colored pencils or markers to make it stand out.
Each person in the group should choose ONE route to do the following (using graph paper or a spreadsheet):
Due Date: Friday at 10:30
 |
| photo credit: Ahmad Nawawi via photopin cc |
Our data
Class assumptions
Based on our class research, a beginning route should be 1.5 mi in length, and walked with a speed of about 3 mi/hr
Based on our class research, an intermediate route should be about 3 mi in length and jogged with a speed of about 5 mi/hr. Some steps should be included.
Based on our class research, a fast route for high aerobic value should be at least 3 mi in length and run with a speed of 7 mph. Steps will increase the challenge.
Design your basic, intermediate, and aerobic routes. Remember, all our measurements are in meters, so you must convert English measurements to metric. (15)
Create a drawing of each route, along with the number of laps Your final drawing should be understandable to people who come in from the community to walk in the morning or after school. (15)
Determine the time for one lap, based on your fitness data. Also determine the total time it will take to complete. (18) SHOW WORK.
If you are over or under in measurements by 100 laps, you may stop.
============Final Turn IN===============
Hand in all of your rough draft work.
Draw each of your maps on this school map Use colored pencils or markers to make it stand out.
Each person in the group should choose ONE route to do the following (using graph paper or a spreadsheet):
- Make a graph for ONE lap that is total distance (not displacement) for each leg of the route. The time for each leg should be based on the average speed of the route. (10)
- Make a v-t graph based on d-t data. (10)
Reflection questions: (20)
1. How likely is it that you can walk or jog at a constant speed for the route you mapped? Explain your reasoning.
2. Why did we map distance and not displacement on our graphs?
3. How would the graphs change if we used velocity instead of average speed for our calculations?
4. Create a dot diagram of the motion every 5 seconds until you get to one lap.
5. How should we publicize this or make it available to our school and/or community to promote fitness activity? Be specific on how you would do this.
Thursday, January 16, 2014
Friday
Part 1: Please go through all of Lesson 3 (3 screens) and Lesson 4 (4 screens)
http://www.physicsclassroom.com/Class/1DKin/U1L3a.cfm
I will be asking about the 'Check Your Understanding' problems on Monday.
Part 2: Use the Logger Pro system and try to see if motion can be constant in real life. Ms. D. will have different ball types (bottom cupboard, left of the sink), cars (bottom cupboard, there are red cars, and green cars (far top cabinet to the right, next to the computers). Remember, the logger pro gold dot only works if it can see the ball. This means that you need to adjust the height of the logger pro. After each trial, save the Logger Pro file to the desktop. Attach to an email and mail to me, or upload in a Google Doc.
Monday, January 13, 2014
Welcome to Physics
Digital Details
- shared google files
- google drive app on phone
- mapowell.org shortcut on phone?
- marciaruthpowellATgmailDOTcom or marciapowellATw-delaware.k12.ia.us
Motion and Dot Graphs Connection
First 20 minutes:
Step 1: Please create your three ticker tapes. When you get them, please write on the tape WHAT you did to get that type of tape. Mark position 0 and tape to the whiteboard under the clock.
Step 2: Ticker walk: Take a strip that you believe has constant motion and one that has non-constant motion. Get a whiteboard and divide it in half. For the first strip, create a sample graph of total distance vs. time, and a sample graph for interval distance vs. time on the bottom half. In both cases, time is the independent variable. NOTE: I said sketches, which means you do not have to measure the distance from dot to dot exactly. Just estimate.
Step 3: On a second whiteboard, write a CLAIM regarding your second strip. The strip itself is EVIDENCE, but you may also want to use a graph or a table. Here, you must represent the motion of at least half of the entire strip. Explain your REASONING for your claim.
Second 20 minutes: Reading, class discussion and mathematical models of straight lines
Last half of class--Motion Man Activity
This activity is done in groups of 2 or 3. If there are more than three names on a sheet, it WILL NOT be accepted.
Click on the activity above. It will eventually launch a new Java script in a separate window. If you are having trouble, we can help. DO NOT click on the icon repeatedly or you will open up multiple copies of the program.
Print the Moving Man Activity for your group. This will be handed in, along with your packet at the end of the class period today. Moving Man Activity
====================================DO not start this until directed-=====================
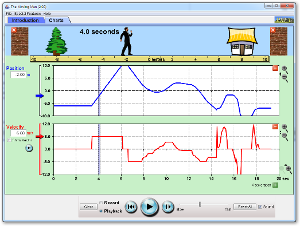
NOTES and PROCESSING For the following situations, sketch a d-t, v-t, and non-zero a-t graphs that show up in your notes (this activity is modified from here). When you get done with the graphs, send me a picture for your group
A) A man moving from the left of the screen (-8 m) to the house (8m) at a constant 2 m/s (adjust the v-slider).
B) A man moving from 0 to the house at a faster pace than above. C) A man standing still at 4 m.
D) A man moving from 0 to the house at a fast pace then moving back to 0 at a slower pace (slide the man manually).
E) A man moving from 16 m to the tree m at a fast pace of (3 m/s).
F) A man moving from 0 to the house, speeding up as he walks (an acceleration of 1 m/s/s).
G) The man stands still while he talks on his cell phone at the middle of the sidewalk, then walks toward the house at a constant rate trying to get better cell reception. He comes to a sudden stop when the coverage is good (about a meter before the house) and stands still to finish his conversation.
H) The man starts close to the tree, stands still for a little while, then walks toward the house at a constant rate for a while, then slows gradually to a stop.
I) A man wakes up from his nap under the tree and speeds up toward the house. He stops because he is worried that he dropped his keys. He stands still as he searches his pockets for his keys. Once he finds them, he continues calmly to walk toward the house and then slows to a stop as he nears the door.
| Click to Run |
Click on the activity above. It will eventually launch a new Java script in a separate window. If you are having trouble, we can help. DO NOT click on the icon repeatedly or you will open up multiple copies of the program.
Print the Moving Man Activity for your group. This will be handed in, along with your packet at the end of the class period today. Moving Man Activity
====================================DO not start this until directed-=====================
NOTES and PROCESSING For the following situations, sketch a d-t, v-t, and non-zero a-t graphs that show up in your notes (this activity is modified from here). When you get done with the graphs, send me a picture for your group
A) A man moving from the left of the screen (-8 m) to the house (8m) at a constant 2 m/s (adjust the v-slider).
B) A man moving from 0 to the house at a faster pace than above. C) A man standing still at 4 m.
D) A man moving from 0 to the house at a fast pace then moving back to 0 at a slower pace (slide the man manually).
E) A man moving from 16 m to the tree m at a fast pace of (3 m/s).
F) A man moving from 0 to the house, speeding up as he walks (an acceleration of 1 m/s/s).
G) The man stands still while he talks on his cell phone at the middle of the sidewalk, then walks toward the house at a constant rate trying to get better cell reception. He comes to a sudden stop when the coverage is good (about a meter before the house) and stands still to finish his conversation.
H) The man starts close to the tree, stands still for a little while, then walks toward the house at a constant rate for a while, then slows gradually to a stop.
I) A man wakes up from his nap under the tree and speeds up toward the house. He stops because he is worried that he dropped his keys. He stands still as he searches his pockets for his keys. Once he finds them, he continues calmly to walk toward the house and then slows to a stop as he nears the door.
Friday, January 10, 2014
Thursday, January 9, 2014
Data collection on Projectiles
You built a catapult or you captured a screencaster vision of a video game..
Catapult: Adjust it so that it is capable of launching a large marshmallow or wiffle ball from a distance of 3 to 5 meters, and hitting a target that is .30 m high +/- .10 m. You will have 5 trials to hit your target at each distance on Friday, and will be graded according to your accuracy. (10 points)
OR
Video game: know the game well enough that you can hit the target that I choose multiple times in a row. You will have 5 trials to prove your mastery of the game, and will be graded according to accuracy (10 points)
Rubric and Questions for Analysis
Using your logger pro data, answer the questions below INDIVIDUALLY and hand in
Where is the biggest frictional in your machine or the game? Explain why this matters to the range. (3 pts)
Determine the maximum range for your machine or game by scaling a known value.. Make at chart that lists all the variables available for y(up), y(down), and x. Below the table, show me or tell me how you arrived at each number.(15 points--one for each variable)
How could you determine F(net) of the projectile? Draw a force diagram and sent to me? (3 points)
How will the net force of the projectile change if we use another projectile of a different mass? Be specific. Why?(3 points)
Pick a change in time of .3 seconds somewhere on your Logger Pro data set. Based on your data, determine v(i) at the beginning of the interval and v(f) at the end of the interval in the x and the y directions Using this data, calculate a 'practical' value for the acceleration in the x and the acceleration in the y-directions. Choose your interval carefully so you are not mixing y(up) and y(down. (6 points)
Write a three to five paragraph summary of how you would change the design if you built another machine, and what you have learned about projectiles and engineering design. Include the following terms: potential energy to kinetic energy changes, frictional force, net force, acceleration of gravity, vectors, kinematic equations, independent x and y motions. (15 points)
TO HAND IN:
a screencast or video with all names attached to it.
an individual review
a Logger Pro screenshot which has data marked on it.
Thursday, January 2, 2014
Using Projectiles
Today's Goal
projectile sim
1. One day after school, you pick up a cracked golf ball in the back yard. You decide to throw it in the trash can with an initial velocity of 3 m/s. What affects whether or not it gets in the can? **
2. The Projectile Motion sim allows several variables that can change: you can change the height of the cannon, the location of the cannon, its angle, etc. A tape measure is present to help you measure heights and distances. Use the sim to test your ideas about the things that affect the landing spot of a projectile.
Make a complete list of things that affect the landing site of a projectile
Next to each item, briefly explain why you think the landing location changes.
Compare your list with another group, discuss your explanations and make modifications.
3. Use the simulation to investigate how the different objects in the simulation affect the shape of the flight path. Summarize your discoveries by including examples with friction and without in the explanations for different flight paths.
4. Launch an object from the cannon at a 30 degree angle and make it hit the target. List the angle, initial speed, and mass of the object before you start. Resolve the initial speed into an x-speed and a y-speed using a vector diagram. Why do these speeds change over time? **
5. Suppose your friend asks you to tell them about projectiles. You start to explain, but she interrupts. “Wait,” she says, “You’re using a lot of words I don’t understand. Can you explain in English?” Knowing that a picture is worth a thousand words, you draw a picture of a projectile path and label all the terms that are on the simulation page. Draw a picture like you would for your friend and write what you would tell her about the terms.
6. Make a perfect parabola projectile with the cannon. Measure d(x) and d(y) down (careful, the distance tool may not work well here), and fill out the project chart, assuming that gravity is -9.8 m/s/s.
7. Throw a set of car keys or pencil into the air and watch it land. Clearly identify the error sources the simulation eliminates or minimizes, compared to launching projectiles yourself and studying the actual flight path and landing spot.
8. Make a chart that goes up by 10 degrees each time, starting with 0 degrees and ending with 90 degrees. Mark the distance in meters traveled for each time. Now, make a x-y graph of the angle vs. distance, where angle is the x-variable.
9. Hand in.
- Predict how varying initial conditions affect a projectile path.
- Use reasoning to explain the predictions.
- Explain projectile motion terms in their own words.
- Describe why using the simulation is a good method for studying projectiles.
Use this simulation to help answer the following questions. For each problem you solve, you must include

- a sketch
- the project chart (all 15 variables) for any problem marked with a **
- any assumptions you had to make
- all data you measured from the simulation marked in a colored pencil
- all data you calculated marked with pencil and work shown.
The project chart
projectile sim
1. One day after school, you pick up a cracked golf ball in the back yard. You decide to throw it in the trash can with an initial velocity of 3 m/s. What affects whether or not it gets in the can? **
2. The Projectile Motion sim allows several variables that can change: you can change the height of the cannon, the location of the cannon, its angle, etc. A tape measure is present to help you measure heights and distances. Use the sim to test your ideas about the things that affect the landing spot of a projectile.
Make a complete list of things that affect the landing site of a projectile
Next to each item, briefly explain why you think the landing location changes.
Compare your list with another group, discuss your explanations and make modifications.
3. Use the simulation to investigate how the different objects in the simulation affect the shape of the flight path. Summarize your discoveries by including examples with friction and without in the explanations for different flight paths.
4. Launch an object from the cannon at a 30 degree angle and make it hit the target. List the angle, initial speed, and mass of the object before you start. Resolve the initial speed into an x-speed and a y-speed using a vector diagram. Why do these speeds change over time? **
5. Suppose your friend asks you to tell them about projectiles. You start to explain, but she interrupts. “Wait,” she says, “You’re using a lot of words I don’t understand. Can you explain in English?” Knowing that a picture is worth a thousand words, you draw a picture of a projectile path and label all the terms that are on the simulation page. Draw a picture like you would for your friend and write what you would tell her about the terms.
6. Make a perfect parabola projectile with the cannon. Measure d(x) and d(y) down (careful, the distance tool may not work well here), and fill out the project chart, assuming that gravity is -9.8 m/s/s.
7. Throw a set of car keys or pencil into the air and watch it land. Clearly identify the error sources the simulation eliminates or minimizes, compared to launching projectiles yourself and studying the actual flight path and landing spot.
8. Make a chart that goes up by 10 degrees each time, starting with 0 degrees and ending with 90 degrees. Mark the distance in meters traveled for each time. Now, make a x-y graph of the angle vs. distance, where angle is the x-variable.
9. Hand in.
Subscribe to:
Posts (Atom)