Monday, February 25, 2013

2/25

NOTE:  This week is mostly studio work.  Ms. Deutmeyer will be in the room as the responsible adult, but YOU are expected to get things done in a timely fashion.  I realize that, just like the workplace, you will have some social time and/or digital checks, but the time given is enough to complete the work IF you don't waste time.

I'll be calling the class probably on Wednesday.  You can reach me via Twitter or email.

Finish your assessment from Friday and hand in by the end of the hour.

===============Activity 1=============

You will be working with groups of 3 to complete the Roller Coaster Project this week and next.  Since I am not there, we'll actually be using a text.

Create a shared Google Folder with me and your partners.   You will be creating a digital portfolio of your work and will be graded on the uploads.

Part 1: Create a shared Google Doc with me.  This is where you journal on the What Do You Think (WDYT) section of the activities before AND after completing each activity.  It will time stamp each time you edit it, so do this NOW, for every activity. DO NOT try to do it later.

Activity 1:   Journal on WDYT on p. 4.   Create a roller coaster with a low thrill factor, a medium thrill factor, and a high thrill factor.   Use the website:   http://kids.discovery.com/game/build-play/build-a-coaster and take a screen shot of each completed coaster.  Paste into a word document.

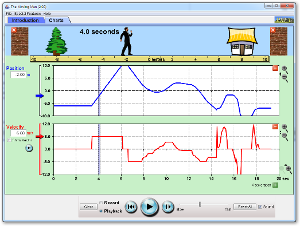
Part C, p. 8.   You will use the BeeSpi as a photogate, found with the materials for the coaster.  Try this out with a marble (by the sink, in a drawer) or a vehicle using a the diagram on p. 10.

Part D. p. 11 Discuss how exciting the coaster on pp. 11 is in comparison to your designs.   Now look at your designs on the word and critique them .   Where is the g-force biggest or smallest on each design.  Answer questions 3-6 on pp. 15 at the bottom of the word document and then upload to the Google folder.

==================Activity 2===========

Journal on WDYT on pp. 17.

Complete #1-6 on pp. 18-20 of the activity.  Upload a summary document with data.

Read pp. 22-26

Complete pp. 1-12 on pp. 29-31

ENERGY in a system is constant.   When it's not moving, we call it potential energy.  When it IS moving, we call it kinetic energy.   So, let's imagine that something has a 100 units of energy at a top of a hill.   We can call that TE.  If it's not moving, KE = 0    TE = KE + PE, so that means, as a result, that 100 = 0 + PE   In other words, the total PE is 100 units.


================Activity 3=================


Energy Skate Park

Complete the activity on energy and place in your Google folder.

===========Activity 4===============

Complete the WDYT on pp. 42-44
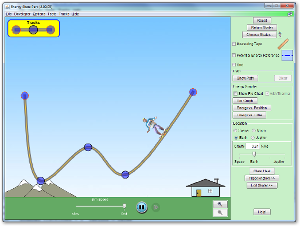

Click to Run


Use the applet to complete te work on pp. 45-47

Friday, February 22, 2013

Video Analysis of Animated Motion

How good is it?  That is that question videographers have to ask each day when they put together animations, whether it it something that is created in 3d (Blender or Maya), or even a stop motion movie.


linked from http://capsicumsunset.files.wordpress.com/2008/09/wile_e_coyote-gravity-lessons.jpg
In original animations, each picture was drawn on a cellulose or acetate sheet, and then a picture was taken of each.   If you look at it frame by frame, you can see that sometimes the images were 'padded' or the same image was used twice in a film to cut down on work for the animators.  We do this today with stop motion animation, an extension of the techniques that have been around since the claymation movies.

A History of Animation tells this story well.  Animation single cells are now sold as collector pieces

In the past five years, this hand-animation has experienced a bit of a renaissance, with both Pixar and Disney doing some still work.  It takes very simple tools.

Digital tweenings then started to take over, with wire-frame animation and user-friendly programs like Flash.  These gave way to more robust programs with physics engines and 3D graphical modeling which have boosted the CGI and animation industries.  

Your project is to look at the physics of motion in movie clips.  You can do this in a variety of ways, but you will need to analyze what is created using Logger Pro.  This includes segments on constant motion, on acceleration and deceleration, and vertical motion.

Possible options include

  • making a stop motion movie
  • comparing two types of animation
  • creating a 2d video of your own that models accurate physics kinematics.

Print or save each of the the Logger Pro analyses, and email them to me, as well as any video products you create.

=========
Group Reflection (Presentation or Linoit)  Using v(i), v(f), d, a, and t variables

1.  How well did you or others animate this project?  What specific evidence do you have to support your claim?
2.   What are three things that could have been done better in this project to mimic reality?  Again, show specific evidence.
3.   Identify a .2 sec time interval.  Identify the initial v(i), and the v(f).  Calculate an acceleration in m/s/s and calculate the distance traveled.  SHOW FORMULAS used.
4.  Find a place where the y-velocity is decreasing for .1 seconds.  Identify the v(i), the distance traveled, and calculate the acceleration in m/s/s.  SHOW FORMULAS used.
5.  Find a place where the x-velocity is relatively constant.  Identify data and calculate the acceleration.  How close does this data match to the assumption that acceleration should be zero?   SHOW FORMULAS used.
6.  Based on your work, and work done in class, which do you believe is the best type of animation:  a) hand-drawn, b) stop-motion movement, c) computer-animated children's programs, d) computer-animated for motion picture movies.    Explain this to me in 2 or more paragraphs, listing advantages and disadvantages of each.


Thursday, February 14, 2013

Thursday and Friday

Identify the variables   Write down the variables shown in the problem.   You can include d, vi, vf, a, and t.  Then tell me the formulas used for solving things.


Create an edible race car that can travel down a ramp and move at least one meter.   You will need to take a side view video and use a logger pro to measure the car motion as it goes down the ramp.

Tuesday, February 12, 2013

Physics Engines and Gaming

Watch the video on the Wikipedia page on physics engines.  Now, think of a game where each one of the 4 situations is present.


Take a look at this prezi.


The code behind such an engine varies, but it is based on physics concepts such as vectors, kinematic formulas, and Newton's laws.

Answer the questions below:


===============

Your goal today is to model a game where one ball hits another ball and then falls of of a table. You will capture the video with your cell phone. Groups of 2 or 3, please. NO groups of 4 or greater. You'll need a top view, as if you are watching a pool game (stand on a chair and video), and you will need a side view, watching the ball falling and making a parabola. Make these videos short, less than 30 seconds. Upload the two files to your Google Drive, and share with me.

================
Begin Lesson 6 in the Physics Classroom tutorial. There are 5 pages to cover. I do not expect you will get it all done, but you should take a few notes.

Friday, February 8, 2013

Group Quiz

Kinematic Curves


Roll a ball down a ramp and watch it recoil.  Capture its motion with a Logger Pro and save the file to the desktop.

You will print the graphs, and then mark the following:

a) the distance measured at .1 second intervals from the time the ball starts moving to the time the ball stops moving.   Make a chart to show this on the graph.

b) the maximum positive velocity of the graph.   Use the data table to help you determine this.

c) an interval from a non-zero velocity to as close to zero velocity as possible.  For this interval, tell me v(i), v(f), d, and the time elapsed (t)


Wednesday, February 6, 2013

Your Vertical Jump

The basic directions for this lab are found here.   Everyone will be working on gathering their own personal set of data.   When you get done, please save the file to the desktop, and then email it to yourself and to me (marciarpowellATgmailDOTcom)


When your group is done gathering the data, use the Moving Man applet to design what the 'ideal' vertical jump should look like.    Print a d-t graph and a v-t graph.

Discuss with your group problems 1-5 from this worksheet.  Turn your answers to this, as well as the moving man graph into Mrs. Deutmeyer at the end of the class.

Tuesday, February 5, 2013

The Moving Man


Create the following systems and print the d-t and v-t graphs:


  1. Someone walks away at 2 m/s for 3 seconds, stops for 2 seconds, and then walks back at 1 m/s
  2. Someone who runs away with an acceleration of 1 m/s/s
  3. Someone who starts at 3 m and then walks away at 1 m/s for 10 m
  4. Someone who starts at 0 m and then walks away at 1 m/s for 10 m
  5. Make the word rum using the program.
When you get done with these, you will try again with the motion detector.

Hand in all sheets at the end of the hour.

Click to Run

Friday, February 1, 2013