For each of your three videos, determine the momentum before and momentum after.
For one of the cases, you will need to do an additional analysis between the pool cue ball and the cue stick. Figure the Force applied for the stick, and identify all variable assumptions you used (t, v(i), v(f), and m(kg)
THESE ARE DUE ON TUESDAY 1/3/12
Wednesday, December 21, 2011
Monday, December 19, 2011
Documentation of the Pool Table
1. Take a picture or picture(s) of the pool table you have created.
2. Take a picture that will allow you to show how the gravity feed system works. If necessary, you may have to edit it to highlight the gravity system.
3. Create a one ball collision with a bumper using a video feed.
4. Create a two ball video between the ball and a second ball that illustrates 1-d momentum.
5. Create a two ball video between the ball and a second ball that illustrates 2-d momentum.
6. Analyze #3-5 using logger pro and the movie feature. Make certain you scale your picture.
7. Print your data.
Analysis will happen tomorrow and Wednesday.
You must email pictures and videos to marciarpowellATgmailDOTcom with your group member names.
Tuesday, December 13, 2011
Impulse and Momentum Pool Tables

This activity is adapted from High Tech High
You will be building a table top pool table.
Requirements
The Detailed Sketch must:
-- Be scaled-down from a full size pool table
-- Be no bigger than 65 cm * 130 cm
-- Be drawn on the computer (I would suggest Google Sketch)
-- Represent the ball return system (not simply pockets)
The Pool Table must:
-- Include handmade billiard balls (golf balls allowed), cue sticks, & racking triangle
-- Be functional
The Ball Return System must:
-- Gather ALL the billiard balls in one area
-- Be easily accessible by the players
-- Be seamlessly integrated with the pool table
Step one: Make a materials list (cardboard is marginally useful, plywood is better), assign roles, and create a sketch of your design (please submit the sketch to me via email)
Step two: Create your pool table by Monday, 12/16 and bring to class
Step three: Notes and Ideas
Momentum ideas
Motion and Vectors
Momentum Applet
Worksheet 1
Worksheet 2
Discuss Blended learning and Physics
Thursday, December 8, 2011
Catapult Analysis
You built a catapult or trebuchet. Adjust it so that it is capable of launching a large marshmallow from a distance of 3 to 5 meters, and hitting a target that is .30 m high +/- .10 m. You will have 5 trials to hit your target at each distance on Friday, and will be graded according to your accuracy. (10 points)
Rubric and Questions for Analysis
Using your logger pro data, answer the questions below INDIVIDUALLY and hand in
Where is the biggest frictional issue in your machine? Explain why this matters to the range of your machine. (3 pts)
Determine the maximum range for your machine. Make at chart that lists all the variables available for y(up), y(down), and x. Below the table, show me or tell me how you arrived at each number.(15 points)
How could you determine F(net) of the projectile? (3 points)
How will the net force of the projectile change if we use marshmallows instead of paper wads? An orange? Why?(3 points)
Pick a change in time of .3 seconds somewhere on your data set. Based on your data, determine v(i) at the beginning of the interval and v(f) at the end of the interval in the x and the y directions Using this data, calculate a 'practical' value for the acceleration in the x and the acceleration in the y-directions. Choose your interval carefully so you are not mixing y(up) and y(down. (6 points)
Write a three to five paragraph summary of how you would change the design if you built another machine, and what you have learned about projectiles and engineering design. Include the following terms: potential energy to kinetic energy changes, frictional force, net force, acceleration of gravity, vectors, kinematic equations, independent x and y motions. (15 points)
Thursday, December 1, 2011
Understanding Projectile Motion
Activity
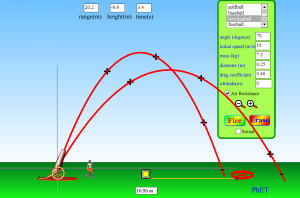
On Friday, we will be testing the wonderful world of catapults. You need to bring a catapult to work on things Friday and Monday.
http://www.chicagotribune.com/features/sns-diy-kids-crafts-catapult,0,1489370.story
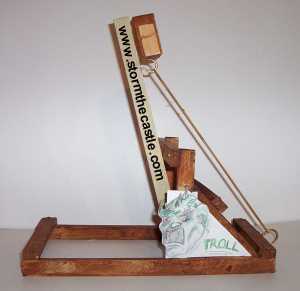
http://www.stormthecastle.com/catapult/how-to-build-a-catapult.htm
http://revision3.com/joegenius/projectiles/homemade-catapults
http://www.youtube.com/watch?v=bY43tGhUSJY
http://www.youtube.com/watch?v=mlGDJZzPRRU&feature=related
http://jimmythejock.hubpages.com/hub/thejockspot_how_to_build_a_catapult
| Click to Run |
On Friday, we will be testing the wonderful world of catapults. You need to bring a catapult to work on things Friday and Monday.
http://www.chicagotribune.com/features/sns-diy-kids-crafts-catapult,0,1489370.story
http://www.stormthecastle.com/catapult/how-to-build-a-catapult.htm
http://revision3.com/joegenius/projectiles/homemade-catapults
http://www.youtube.com/watch?v=bY43tGhUSJY
http://www.youtube.com/watch?v=mlGDJZzPRRU&feature=related
http://jimmythejock.hubpages.com/hub/thejockspot_how_to_build_a_catapult
Monday, November 28, 2011
Bungie Barbie

Procedures:
Produce as least 4 different graphs by dropping Barbie with different cords. Use the evidence to collect a rationale for the common use of rubber as a bungie cord, and whether it is supported by your data.
Sketch, describe, print or save your graphs for each "jump". Clearly indicate which cord or material was used. Also include information such as the amount of force and the time over which the force was applied. Record any relevant observations you saw during the jump.
Individual Conclusions (1/2 to 1 page, plus tables)
Describe the ideal harness for a bungie jumper so that net force is distributed across the barbie. This should be based on data you gathered when Barbie parachuted. Explain how the net time for the Barbie to stop jumping can affect a force distribution. (Think carefully: F=ma, but a = change in velocity/change in time)
Based on your data, is it possible to argue that there is a better material for a bungie jump than rubber? Why or why not?
What questions arose in the lab? What information have you found?
Monday, November 21, 2011
Understanding the Hill
| Click to Run |
Today, we're going to push something on a hill, and balance it on a hill.
This requires us to look at the force vector of gravity in a component fashion.
=======================
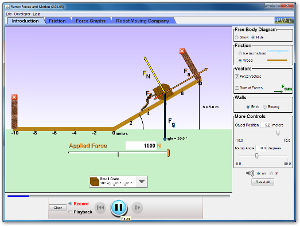
1. Joe is going off to college and is loading his file cabinet onto the moving truck by sliding it up a ramp with a 10 degree angle.
a. Sketch what you think the free body diagram would look like for the file cabinet and explain your reasoning.
b. Use Ramp: Force and Motion to simulate Joe’s situation. Compare your free body diagram to the simulation and make any corrections to your drawing and reasoning.
c. Investigate the simulation to see what effects how hard Joe must push to move the cabinet up a ramp.
d. Describe your experiments and results including the free body diagrams.
e. Draw the free body diagrams for the cabinet if it were being pushed on a flat surface and if it were being lifted straight up. Compare those to the ones you observed on the ramp, and then describe the differences and similarities.
2. Next, Joe wants to load his crate of books.
a. Predict what you think the free body diagram would look like.
b. Explain what might cause similarities and differences between Joe moving the crate versus the file cabinet.
c. Test your prediction and thoughts using the simulation.
d. Describe your experiments and results including the free body diagrams.
3. Think of some other things that Joe might want to move using a ramp and explain what he would have to consider when thinking about how hard to push.
4. Joe has some friends that want to help, but they’re not as strong. How do you think the ramp design be changed so they could help? Verify or adjust your ideas by experimenting with the simulation.
5. Joe wants to stop on the ramp to catch his breath. Would he be better off stopping on a rough spot on the ramp or a smooth spot? Verify or adjust your ideas by experimenting with the simulation.
6. Joe is moving his refrigerator to take to college and he begins by pushing it across the wooden kitchen floor.
On a flat surface like the floor, how do you calculate how hard he needs to push? Draw a free body diagram to help explain your answer and use the simulation Ramp: Force and Motion to check your ideas. Record the minimum force Joe would have to use to move the refrigerator on the kitchen floor.
7. Later, Joe is ready to load his refrigerator onto the moving truck.
a. Explain how he would calculate how much force to use to lift the refrigerator straight up into a truck.
b. Joe starts thinking about easier ways to get it in the truck and remembers he has some wood that he could use to make a ramp. How could he calculate the minimum force needed to push it up the ramp?
c. Use the simulation to check your ideas by running experiments with different objects at several angles. Make a data table including several trials with the calculations.
Ramp
angle
Weight (Fg)
Fgravity
Ffriction
Fapplied
Resulting motion (stationary, down ramp or up ramp)
Fnet calculation
Wednesday, November 9, 2011
Thursday, 11/10/11
You should have two bumper tests, with the data saved to a computer desktop and/ or printed. Make sure you have the data tables as well as the graphs.
You should be done with the review sheets. We'll be going over them Friday.

You should work on this activity when you get done. It is due Monday at the beginning of class. It must be handed in INDIVIDUALLY to receive credit, even if you collaborate on the problem.
You should be done with the review sheets. We'll be going over them Friday.
| Click to Run |
You should work on this activity when you get done. It is due Monday at the beginning of class. It must be handed in INDIVIDUALLY to receive credit, even if you collaborate on the problem.
Monday, October 31, 2011
Building a bridge
Task 1: Show me your bridge designs.
Task 2: Build a model suspension bridge
Task 3: Take a look at different types of bridge designs and create a summary poster.
Task 4: Minimize the cost on your bridge.
Task 5: Build a truss bridge model using filing paper and bamboo skewers. This must be done IN CLASS
Due Date: Wednesday (sometime) we'll be testing the bridges.
=======
This entire sheet should be 1-2 pages long, hand-written or typed
Task 2: Build a model suspension bridge
Task 3: Take a look at different types of bridge designs and create a summary poster.
Task 4: Minimize the cost on your bridge.
Task 5: Build a truss bridge model using filing paper and bamboo skewers. This must be done IN CLASS
Due Date: Wednesday (sometime) we'll be testing the bridges.
=======
Bridge Reflection
Reflection on Bridge Building
Test your bridge, and measure the mass in kg that it holds.
Send a picture or video to marciarpowellATgmailDOTcom List your group members.
Watch the video
Answer the following
- How much did your bridge hold?
- How much did it cost, and how did you minimize your costs?
- What is the mass of your bridge (using a scale)? Convert to kg.
- Calculate the force weight of the bridge, and the force weight of the load applied.
- Calulate a ratio to show me the strength of the bridge (load/bridge)
- Using the member data sheet, which bridge member held the greatest load? How do you know?
- Can a member experience both compression and tension? Explain.
- IS your bridge model a good fit for the bridge you made in the program? Why or why not?
- Draw a force diagram for your bridge when the truck is on the left-hand side of the structure.
- How does friction matter in this project?
- Explain why a truss bridge is more common than a cable-stayed bridge over small creeks.
- What have you reinforced in this project about statics, force diagrams, angles, and vectors.
This entire sheet should be 1-2 pages long, hand-written or typed
Thursday, October 27, 2011
West Point Bridge Design
Review the Mu of the Shoe reading. Pick 6 of the physics to go problems andcomplete. Hand In.
You need to get to the idea of equilibrium and statics cemented in to your head.
Go to the tutorial on the West Point Bridge Designer. The tutorial was designed with an earlier version of the software, but it will give you the basic idea. Take 5 minutes and read it....seriously.
West Point Bridge Design 2011 software should be on your computer but if you want to download it at home or need to update the copy, you can get the software here IF THE COMPUTER ASKS YOU FOR A PASSWORD, ask Mrs. Deutmeyer for it. You may have to log in as an administrator or a teacher.
Create a truss bridge and a suspension bridge and save to a flash drive or your network files for Monday. If you want to get an idea or two on minimizing cost, check out some of the videos on YouTube.
.
Wednesday, October 26, 2011
Understanding Newton's Laws
Task 1: Creating a two-stage rocket and analyzing using Logger Pro.
Task 2: Determining the mu of the shoe.
Task 3: Going over the work. Place your mu values on the form for at least 3 surfaces
Using your data, try to figure out the acceleration for
a)when we first started to push the rocket
b)when the rocket was going at a constant speed
c) when the second person was pushed
d) when deceleration occured.
Create a force diagram for each of these.
Watch this video, starting at 1:25:
This video is optional.
We will have a class meeting Thursday at 10:40; all work needs to be completed by this time.
Tuesday, October 25, 2011
Static Forces
Static Forces describe things that are not moving. We generalize these to things that are moving with no net force. You are being asked to complete three tasks that use examples of no net force.
 Task 1: Set up a diagram with a 500g mass and two spring scales. Change the angle between the strings to 0, 30, 60, 90, and 120 degrees. For each trial, record the scale value on the left and the scale value on the right. To do this, each string must be approximately the same length. Record your data in the group form.
Task 2: Use a logger pro to record the net velocity and acceleration for three trials of a car. For the first trial, the car should stand still. For the second, the car should be given a sharp push. For the third, a constant velocity buggy should be used. In each of the graphs, identify where NO acceleration and where CHANGING acceleration is taking place. Calculate the CHANGING acceleration or the constant velocity for two places in each trial.
Task 3: Learn to use force diagrams as you work through ws1, ws2, and q1. There are some common conventions, shown in the pictures below.
Thursday, October 20, 2011
Learning about Forces
Starting discussion about the roadtrips!
Content Reading Motion Maps for Lesson 1 and Lesson 2 (2 computers/table...one to read, one to make a wallwisher or linoit concept map)
Forces and Motion Activities 2.1.1 to 2.1.5
Content Reading Motion Maps for Lesson 1 and Lesson 2 (2 computers/table...one to read, one to make a wallwisher or linoit concept map)
Forces and Motion Activities 2.1.1 to 2.1.5
Tuesday, October 18, 2011
Wednesday, 10/18/11
Today is your last assessment for the quarter. You may solve this problem either graphically or by scaling. Protractors and rulers are available. SHOW all work.
You must break things into component vectors, and then determine the net displacement. Because I used Google Earth to set this up, it probably won't add up to zero and zero, but it should be close. This is worth 30 points.
When you get done, you will pair with someone and come up with a road trip based on one of your courses. This is a CREATIVE effort (scrapbook, google earth tour, prezi, linoit, creative writing experience) and is worth 20 points.
Monday, October 17, 2011
Practice for Tomorrow's Assessment--Pilot Navigation

1. Make a sketch before even ATTEMPTING this problem.
2. Break each vector into components.
3. Find the total net displacement.
4. Using your two net displacement vectors, determine the total distance traveled, and the original heading the pilot could have used if s/he were flying in a straight line.
Show me work and your answer before leaving the classroom today.
Tuesday, October 11, 2011
Vector Unit
You have done a great job exploring vectors! The golf courses were awesome.
This week, I need you to accomplish the following:
1. Use the Open Office clone of Powerpoint to make a scaled drawing of one of the holes from the course to see how Microsoft handles vectors Each one must have a compass rose on it. Save these to the Desktop of the computer. Ask your teacher to help you, as we digitally find the x and y components and calculate the vector angles. Then, duplicate the slide, and flip the hole horizontally. Duplicate the second slide and flip it vertically. Repeat what you did for the first slide on these other two. Explain to me in poster format how digital programming uses vectors.
2. Finish your assignment from Friday and do a net displacement analysis.
3. Create a web 2.0 product that shows me value of GPS. This includes how the vectors are calculated.
4. Explain and show me how Google Maps on a smart phone can be used for GPS. In particular, I will need to know the GPS location of
- the SE corner of the High School Auditorium,
- the mailbox on New Street,
- the home dugout on the softball field,
- the SW gate of Brown field
- the bell on New Street
- landmark of your choosing
- landmark of your choosing
- landmark of your choosing
Friday, October 7, 2011
Wednesday, September 28, 2011
Thursday and Friday, 9/29 and 9/30
Thursday:
- Take the test. The wonderful sub has it on her desk. Spread out so you have room and hand it in when you are done. Mr. Shaw and Mr. Fessler will write the formulas on the board for you to use, as well as the five possible variables: d, vi, vf, a, t. If you have a question, ask those two and they will try to help you.
- Get in teams of 2 or 3 people. You will be going through Lesson 1 For each lesson, you must draw a picture, and write a one or two sentence summary. Put your group member names on it and hand in.
- Hand in any missing documents you want graded
- Go through as much of the PHET Vector summary as possible. Hand in on Thursday and then again on Friday. This also will be done in groups. (I realize that you don't all have this background, which is why you need to do the reading first.)
- Text me at 563SIXZEROEIGHT1900 if you need anything.
Friday is a really short day! Happy homecoming!
Monday, September 19, 2011
Project 2: Runner Guide
 |
| Example of a split table |
Runners need to understand their SPLIT times in order to train effectively. The idea of a split is to chunk a race and figure out the acceleration and average velocity of time intervals.
We will use a car that is pushed as our model for the runner. You will create a Logger Pro graph, and figure the acceleration and average velocity of at least 5 intervals. Based upon the data you receive, you need to develop a recommendation of how a runner that ran this race should change his or her strategy over a period of weeks so they can run on a a) flat course or b) a course that has a series of 3 hills on it (you can specify which is biggest, medium, and smallest)
You will turn in:
* a logger pro graph
*five intervals of data, showing calculations
*a list of recommendations for the runner
Rubric for Grading:
5 points: Logger pro graph that shows evidence of acceleration and deceleration over a period of 6 or more seconds.
10 points: Data intervals, including labeled variables and correctly calculated average velocity and acceleration
10 points: The meaning of the split intervals
20 points: List of recommendations for the runner based on a set of conditions you choose (either a) or b))
5 points: Quality of the presentation/creativity
http://www.runsplit.com/rsa5.htm
http://www.active.com/running/Articles/Why_You_Should_Run_Negative_Splits.htm
Friday, September 16, 2011
Tidying Up the Pieces
At the end of today, 9/16, you should hand in a team binder with the following.
- individual copies of WS4
- the Logger Pro data, with two sets of calculations on acceleration per graph
- a half to one page reflection of how well your edible car worked PLUS a video
Friday, September 9, 2011
Unit 2: Acceleration, Graphs and (finally?!) Formulas
Task 1: You need to form groups of 3 to 4. This will be your team for the unit. In this group, you will assign roles:

Task 2: Logger Pro and the world of motion. Use a ramp and a cart to create a series of d-t and v-t graphs. For each, you need to print the screen (one copy PER group), and then highlight 4 evenly-spaced time points on the v-t and d-t graphs. For these, you will note the individual distances, velocities and times using the data chart to the right. The setups include:
Task 4: Copy the motion formulas on a notecard to be placed into your calculator or binder. You must complete Worksheet 4 individually using both graphs AND formulas.
d = v(i)t + 1/2at^2
d = t * [v(i) + v(f)] /2
v(f) = v(i) + at
v(f)^2 = v(i)^2 + 2ad
- the planner/clearnup organizer
- the techie dude
- the setup person
- the paperwork person
Task 2: Logger Pro and the world of motion. Use a ramp and a cart to create a series of d-t and v-t graphs. For each, you need to print the screen (one copy PER group), and then highlight 4 evenly-spaced time points on the v-t and d-t graphs. For these, you will note the individual distances, velocities and times using the data chart to the right. The setups include:
- a motion detector at the top of a ramp, and a cart traveling down
- a motion detector at the bottom of a ramp and a cart traveling towards (but not hitting) the motion detector
- a motion detector attached to the ceiling and someone creating a vertical jump by standing, crouching, jumping, and then standing again
- a motion detector that is at the top of a ramp and a cart that is pushed up from the bottom, and then allowed to fall again.
Task 4: Copy the motion formulas on a notecard to be placed into your calculator or binder. You must complete Worksheet 4 individually using both graphs AND formulas.
d = v(i)t + 1/2at^2
d = t * [v(i) + v(f)] /2
v(f) = v(i) + at
v(f)^2 = v(i)^2 + 2ad
Wednesday, September 7, 2011
Finishing Projects
This writeup IS the majority of your first test (you will have ONE graphing question tomorrow) and is worth 40 points. Your writeup can be a blog post to me, a Google Doc, a hand-written note, or a mind-map. It must be a unique document from anyone else's in the room. I realize your are sharing data but your opinions, your ideas, and your understandings must be articulated.
The rubric will be articulated in class, and then posted to this blog.
Use your data gathered to answer the question: Which is better, hand-animated or digitally-animated cartooning? Answer for each of the following four factors:
2. Explain how technology was used in this project, including:
3. Explain whether your data better reflects the laws of physics from your daily living or the laws of Cartoon physics, shown below.
A wacky character has the option of self-replication only at manic high speeds and may ricochet off walls to achieve the velocity required.
The painter is flattened against the wall when he attempts to follow into the painting. This is ultimately a problem of art, not of science.
The rubric will be articulated in class, and then posted to this blog.
Use your data gathered to answer the question: Which is better, hand-animated or digitally-animated cartooning? Answer for each of the following four factors:
- constant horizontal motion
- constant vertical motion
- changing horizontal motion
- appearance and quality of the cartoon
2. Explain how technology was used in this project, including:
- file types, including avi, mpg, mov, mp4,flv etc
- codecs, and why they matter
- the difference between rendered videos and video projects
- how to use and install a screen capture utility
- how to use Windows Movie Maker, Uploading features, and digital video
3. Explain whether your data better reflects the laws of physics from your daily living or the laws of Cartoon physics, shown below.
Cartoon Law I
Any body suspended in space will remain in space until made aware of its situation. Daffy Duck steps off a cliff, expecting further pastureland. He loiters in midair, soliloquizing flippantly, until he chances to look down. At this point, the familiar principle of 32 feet per second per second takes over.Cartoon Law II
Any body in motion will tend to remain in motion until solid matter intervenes suddenly. Whether shot from a cannon or in hot pursuit on foot, cartoon characters are so absolute in their momentum that only a telephone pole or an outsize boulder retards their forward motion absolutely. Sir Isaac Newton called this sudden termination of motion the stooge's surcease.Cartoon Law III
Any body passing through solid matter will leave a perforation conforming to its perimeter. Also called the silhouette of passage, this phenomenon is the speciality of victims of directed-pressure explosions and of reckless cowards who are so eager to escape that they exit directly through the wall of a house, leaving a cookie-cutout-perfect hole. The threat of skunks or matrimony often catalyzes this reaction.Cartoon Law IV
The time required for an object to fall twenty stories is greater than or equal to the time it takes for whoever knocked it off the ledge to spiral down twenty flights to attempt to capture it unbroken. Such an object is inevitably priceless, the attempt to capture it inevitably unsuccessful.Cartoon Law V
All principles of gravity are negated by fear. Psychic forces are sufficient in most bodies for a shock to propel them directly away from the earth's surface. A spooky noise or an adversary's signature sound will induce motion upward, usually to the cradle of a chandelier, a treetop, or the crest of a flagpole. The feet of a character who is running or the wheels of a speeding auto need never touch the ground, especially when in flight.Cartoon Law VI
As speed increases, objects can be in several places at once. This is particularly true of tooth-and-claw fights, in which a character's head may be glimpsed emerging from the cloud of altercation at several places simultaneously. This effect is common as well among bodies that are spinning or being throttled.A wacky character has the option of self-replication only at manic high speeds and may ricochet off walls to achieve the velocity required.
Cartoon Law VII
Certain bodies can pass through solid walls painted to resemble tunnel entrances; others cannot. This trompe l'oeil inconsistency has baffled generations, but at least it is known that whoever paints an entrance on a wall's surface to trick an opponent will be unable to pursue him into this theoretical space.The painter is flattened against the wall when he attempts to follow into the painting. This is ultimately a problem of art, not of science.
Cartoon Law VIII
Any violent rearrangement of feline matter is impermanent. Cartoon cats possess even more deaths than the traditional nine lives might comfortably afford. They can be decimated, spliced, splayed, accordion-pleated, spindled, or disassembled, but they cannot be destroyed. After a few moments of blinking self pity, they reinflate, elongate, snap back, or solidify.Corollary:
A cat will assume the shape of its container.Cartoon Law IX
Everything falls faster than an anvil.Cartoon Law X
For every vengeance there is an equal and opposite revengeance. This is the one law of animated cartoon motion that also applies to the physical world at large. For that reason, we need the relief of watching it happen to a duck instead.Cartoon Law Amendment A
A sharp object will always propel a character upward. When poked (usually in the buttocks) with a sharp object (usually a pin), a character will defy gravity by shooting straight up, with great velocity.Cartoon Law Amendment B
The laws of object permanence are nullified for "cool" characters. Characters who are intended to be "cool" can make previously nonexistent objects appear from behind their backs at will. For instance, the Road Runner can materialize signs to express himself without speaking.Cartoon Law Amendment C
Explosive weapons cannot cause fatal injuries. They merely turn characters temporarily black and smokey.Cartoon Law Amendment D
Gravity is transmitted by slow-moving waves of large wavelengths. Their operation can be wittnessed by observing the behavior of a canine suspended over a large vertical drop. Its feet will begin to fall first, causing its legs to stretch. As the wave reaches its torso, that part will begin to fall, causing the neck to strech. As the head begins to fall, tension is released and the canine will resume its regular proportions until such time as it strikes the ground.Monday, August 29, 2011
Unit 1, Week 3, Kinematics

Task 1: We are starting to look at old animation techniques (frame-by-frame) vs. new (computer). To do this, we have to capture some video using a video capture (screen capture) utility. Alternatively, you can use a good video camera and get a clip from a tv set, but then you have to convert it to a from that the computer will accept.
Your task is to get a clip of a digitally animated system that is 30 to 40 seconds long and shows constant horizontal motion, changing horizontal motion and vertical motion. You need to upload this video as a .avi file to your document storage in Google Docs, and share with your group and with me.
Along the way, you need to PERSONALLY document in some way the differences the following concepts (I will ask for this on Friday):
- file types, including avi, mpg, mov, mp4,flv etc
- codecs, and why they matter
- the difference between rendered videos and video projects
- how to use and install a screen capture utility
- how to use Windows Movie Maker, Uploading features, and digital video
Task 3: Repeat Task 2 with the uploaded video that I have approved from Task 1.
Task 4: Start gathering ticker tape data for six situations on your video. To do this, we will need to use a Windows Media Maker project, not an actual video. This video data must be entered into a Google Docs Spreadsheet and a scattergram must be generated for all six of them.
Expect a quiz on Friday.
Wednesday, August 24, 2011
Unit 1, Week 2, Kinematics
Task 1: Yesterday, at the end of class, we started discussing models. We've used several in this class already. A model is a piece of information that shares some, but not all, pieces of reality. For example, a globe of the earth doesn't ACTUALLY have water, or active volcanoes, or wind and weather. It's designed to let us see where everything is at in relationship to something else.
What do each of these models do with regards to velocity? What aspects of reality do they lack? Discuss this with your partners in the class and place into your binder.
Task 2: V-t graphs are another type of model. If you cut apart the intervals strips on a ticker tape, you can see what is happening to the velocity (the interval/unit time) over a series of time periods. Yeah, that's a bit confusing. Basically, you are separating the strips on a ticker time into small sections and then go again.

This would be long and tedious if we always had to do ticker strips, right?
So, there is another way. We determine the slope of the d-t graph and that becomes the value for the v-t graph. It all starts with the ticker tapes, but Logger Pro can help us out with the details as we get ready. Use the logger pro to do the activities suggested here. For each one, you will need to record in your notebook what the d-t graph looks like, what the v-t graph looks like, and what you think the ticker tape would look like.
Task 3: We've got to be able to go from one graph to another quickly in our minds. That's what this task is for, and why you need to complete it individually. Copies are available by my desk.
Task 4: Review for next week's quiz.
What do each of these models do with regards to velocity? What aspects of reality do they lack? Discuss this with your partners in the class and place into your binder.
- ticker tape
- video tape
- d-t graph
- equation associated with the d-t graph
- logger pro information
We'll take a look at the models as we try this work. It must be completed individually, and there are copies by my desk if you want them.
Task 2: V-t graphs are another type of model. If you cut apart the intervals strips on a ticker tape, you can see what is happening to the velocity (the interval/unit time) over a series of time periods. Yeah, that's a bit confusing. Basically, you are separating the strips on a ticker time into small sections and then go again.
This would be long and tedious if we always had to do ticker strips, right?
So, there is another way. We determine the slope of the d-t graph and that becomes the value for the v-t graph. It all starts with the ticker tapes, but Logger Pro can help us out with the details as we get ready. Use the logger pro to do the activities suggested here. For each one, you will need to record in your notebook what the d-t graph looks like, what the v-t graph looks like, and what you think the ticker tape would look like.
Task 3: We've got to be able to go from one graph to another quickly in our minds. That's what this task is for, and why you need to complete it individually. Copies are available by my desk.
Task 4: Review for next week's quiz.
Tuesday, August 23, 2011
Individual Practice--this is an OPTIONAL activity to help you study
Distance-Time Ticker Tape graphs (try each of the problems)
Varying velocities
Optional reading (check your answer at the bottom is especially helpful)
Varying velocities
Optional reading (check your answer at the bottom is especially helpful)
Thursday, August 18, 2011
Unit 1, Week 1, Kinematics
Your goal during the first three days is to make sure all of you will know how to do the following tasks. Students who feel ready to be assessed for understanding need to see ::mapowell:: Don't worry if you aren't working on the same task as others. Your group knows what you need.
My goal is to help as needed. You don't need a babysitter, but you may need some help in figuring out where to start and how to deal with confusion. Help one another and listen when I try to help you.
Task 1: Create motion strips for a) constant velocity, b) no velocity, c)(+) acceleration, d) (-) acceleration, and e) random motion. Document each strip in photos and upload to google docs in a shared collection, along with accompanying x-y scatter graphs. Share with each of the members in your group and with me
You may wish to use the online curriculum on the left, or check here, here, and here.
Task 2: Create a flip or blackberry video that details motions of each of a) to e) above using a toy car. To do this, you must shoot a side-to-side motion. Upload the video to youtube and email me the URL/embed code.
Task 3: Walk steps a) to e) listed above with a Logger Pro setup. You will need to learn how to use the Logger Pro, and you must print each of five graphs along with the accompanying data set to show ::mapowell::
Task 4: Formative assessment check. Ask when you are ready to take this on an individual basis.
Critical questions:
My goal is to help as needed. You don't need a babysitter, but you may need some help in figuring out where to start and how to deal with confusion. Help one another and listen when I try to help you.
 |
| Strobe picture of person throwing balls |
You may wish to use the online curriculum on the left, or check here, here, and here.
Task 2: Create a flip or blackberry video that details motions of each of a) to e) above using a toy car. To do this, you must shoot a side-to-side motion. Upload the video to youtube and email me the URL/embed code.
Task 3: Walk steps a) to e) listed above with a Logger Pro setup. You will need to learn how to use the Logger Pro, and you must print each of five graphs along with the accompanying data set to show ::mapowell::
Task 4: Formative assessment check. Ask when you are ready to take this on an individual basis.
Critical questions:
- can we perfectly model constant motion?
- how does speed differ from velocity or acceleration?
- if you aren't moving, are you going at a constant or variable velocity?
Call of Duty Prompt
Well, what do you think? Is this well-animated or not with respect to speed, velocity, or acceleration? How fast does an object have to move to be 'animated?'
Tuesday, May 17, 2011
Catapult Project
Build a trebuchet that is capable of launching a large marshmallow from a distance of 3 to 5 meters, and hitting a target that is .30 m high +/- .10 m. You will have 5 trials to hit your target at each distance, and will be graded according to your building design, accuracy, and analysis.
Trebuchet Experiments (needs Java)
Rubric and Questions for Analysis
(Print this part of the blog post and complete individually)
# hits at 3 m __________ # hits at 4 m__________ # hits at 5 m__________
Now, determine the velocity of the object using a video that shoots a cross-view of the projectile's motion. This video must be uploaded to marciarpowell@gmail.com You must analyze the video using logger pro before doing the analysis below.
- Where is the biggest frictional issue in your machine? Explain why this matters to the momentum of the mallow.
- Determine the maximum range for your trebuchet, t(calc), and the initial values of v(x) and v(y) including a diagram using logger pro
- How could you determine F(net) of the mallow?
- How will the momentum of the projectile change if we use jawbreakers instead of marshmallows? An orange? Why?
- Pick a time frame for your catapult. Determine the change in t, the acceleration due to gravity, and the distance traveled. Based on this, calculate v(i) at the beginning of the interval and v(f) at the end of the interval in the x and the y directions. Choose your interval carefully so you are not mixing y(up) and y(down)
- Write a three to five paragraph summary of how you would change the design if you built another machine, and what you have learned about physics. Include the following terms: potential energy, kinetic energy, frictional force, net force, acceleration of gravity, vector errors, kinematic equations, independent x and y motions.
Tuesday, May 10, 2011
Friday, May 6, 2011
GUILTY UNTIL PROVEN INNOCENT--a 2d momentum analysis

Problem:
How can you use the conservation of momentum to prove to a judge that you were not speeding and therefore do not deserve a ticket for the collision?
Materials:
Poster paper, protractor, ruler, calculator
Procedure:
You leave the school teacher's parking lot and are traveling north when you are broadsided by a car traveling east. The collision occurs in a school zone with a speed limit of 20 mph. The impact throws you into the band practice field.
Following the collision the police officer determines that both vehicles had a speed of 22 mph (9.8 m/s). The driver of the other car is an adult and claims that you were speeding and consequently should receive a ticket. You are to prove your innocence by using the conservation of momentum.
Research:
What type of a vehicle were you driving? What type of a vehicle was the other driver riding in? Look again at the safety and the mass of these vehicles at the NHSTA site (http://www.safercar.gov ). Use the same vehicle you looked up earlier this week.
Your vehicle_______________ Mass or weight____________
Their vehicle_______________ Mass or weight____________
Decide on the units for your momentum and record here ____________
Draw a diagram of the two cars just prior to impact. You were headed north, the other car was headed East. Choose a scale (e.g., 1 cm = kg m/s) or freehand draw a diagram of the vehicles before AND after the impact your calculation .
There are two possible cases. In Case 1, you were going 20 mph. In Case 2, they were going 20 mph. One things for sure. After the collision, you were stuck together and both of you traveled at 22 mph.
Do one set of calculations for each Case.
Summing Up (each person does this individually,1/2 to 1 page, and hands it in paper clipped to the diagrams)
1. Qualitatively explain, using your diagrams, how you know that you were not going faster than the adult. Remember that a ticket means higher insurance rates and a large fine.
2. Do you think you were you speeding?
3. How would angles affect your logic?
4. What evidence of impulse or guilt would the police collect in this action?
5. Based on the safety rating of the vehicles involved, what do you think the extent of the injuries would be?
5. Based on the safety rating of the vehicles involved, what do you think the extent of the injuries would be?
Thursday, May 5, 2011
Using Video with Logger Pro
Video collection
Analyze before and after pictures for momentum for at least 3 of the data sets below.
Analyze before and after pictures for momentum for at least 3 of the data sets below.
Thursday, April 28, 2011
Momentum, Impulse, and Crash Scenes

http://www.edheads.org/activities/crash_scene/swf/index.htm
You will have one hour to complete as much of the investigation as possible.
Wednesday, April 27, 2011
Momentum problem day.
Watch the Khan academy video as a class
Go through the worksheet packet as far as possible. This should include the first two worksheets by tomorrow.
Go through the worksheet packet as far as possible. This should include the first two worksheets by tomorrow.
Wednesday, April 20, 2011
Monday, April 18, 2011
Monday, 4/18
Bungie Barbie Writeup
Please finish the test review in your packet. Questions 7 and 13 are optional.
The review will be corrected on Wednesday in class, so you should have tried all problems. TEST Thursday.
Bungie Barbie is due by Monday, but earlier is preferred.
Please finish the test review in your packet. Questions 7 and 13 are optional.
The review will be corrected on Wednesday in class, so you should have tried all problems. TEST Thursday.
Bungie Barbie is due by Monday, but earlier is preferred.
Wednesday, April 13, 2011
Barbie and the SeatBelt
Look at the following:
http://www.teachersdomain.org/asset/eng06_vid_airbag/
http://www.safetyforum.com/seatbelts/
Draw a diagram for your force net for both the collision into the wall and the collision with cups.
Determine Barbie's g-force in each case (accel/accel(g)). Determine the net force on Barbie, using the accelerometer value, and the Net force on Barbie and the car.
Comment on the design of your seat belt and bumper in terms of a) durability b) safety and c) similarity to air bag principles.
Write a one page summary of what you have learned.
Tuesday, April 5, 2011
Wed, 4/6
1. Take the test. The substitute will have it for you. No more than 3 people at a table, please. Others can use a whiteboard or the counters as their space.
When you get finished, you will be going to the Phet Filing Cabinet lab and doing the activity found here Please note that the 'coefficienct of friction' is what we call 'mu'
When you get finished, you will be going to the Phet Filing Cabinet lab and doing the activity found here Please note that the 'coefficienct of friction' is what we call 'mu'
Thursday, March 31, 2011
Wednesday, March 30, 2011
Bridge Reflection
Reflection on Bridge Building
Test your bridge, and measure the mass in kg that it holds.
Send a picture or video to marciarpowellATgmailDOTcom List your group members.
Watch the video
Answer the following
- How much did your bridge hold?
- How much did it cost, and how did you minimize your costs?
- What is the mass of your bridge? Convert to kg.
- Calculate the force weight of the bridge, and the force weight of the load applied.
- Calulate a ratio to show me the strength of the bridge (load/bridge)
- Using the member data sheet, which bridge member held the greatest load? How do you know?
- Can a member experience both compression and tension? Explain.
- IS your bridge model a good fit for the bridge you made in the program? Why or why not?
- Draw a force diagram for your bridge when the truck is on the left-hand side of the structure.
- How does friction matter in this project?
- What have you learned in this project about statics, force diagrams, angles, and vectors.
This entire sheet should be 1-2 pages long, hand-written or typed
Tuesday, March 8, 2011
Google Earth
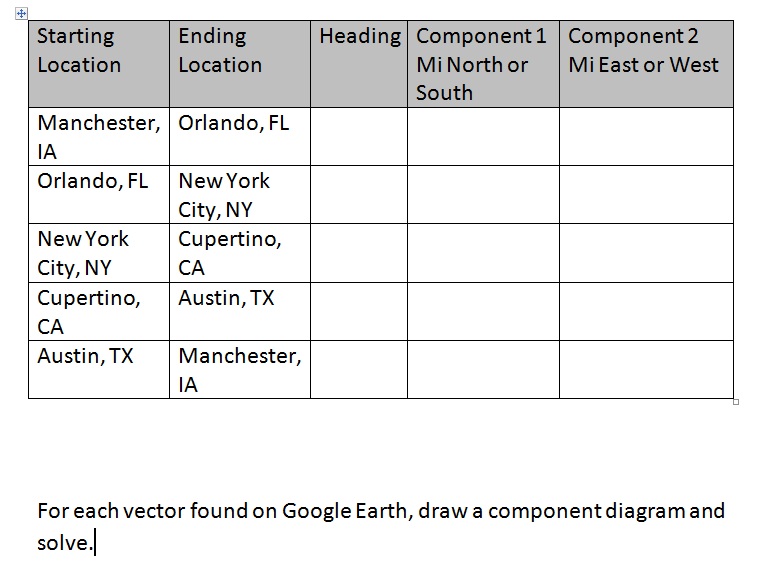
You are headed on a dream vacation! Start at Manchester, and zoom around the globe using Google Earth in the North Lab. At least one place must be south of the equator, and place east of London. As you travel (on at least ten stops), keep track of the latitude and longitude for each place, and the vector heading from point to point
Day 2:
Create a scrapbook of activities and interesting highlights (You can print photos, and please write down 2 or 3 observations for each place. Ask other classmates who scrapbook for ideas...
Note the length and the angle of each leg of your trip. You must resolve this into component vectors using a diagram and trig functions.
NOTE: You can take a partner on your trip, but the reflection must be done individually.
REFLECTION QUESTIONS
b) Based on the component vectors and the curvature of the earth, could we easily determine a scale where 1cm = _____ miles. Why or why not?
c) How does a GPS use vector determinations as it calculates location? Did this give you any unexpected results? Explain.
d) Give three examples where a vector must be exact to the nearest mm.
e) Give three examples where a vector must be exact to the nearest m.
f) Give three examples where a vector must be exact to the nearest km.
g) Given what you have learned about vectors, when are scale drawings useful? When should you switch from a paper map to a digital device?
Day 2:
Create a scrapbook of activities and interesting highlights (You can print photos, and please write down 2 or 3 observations for each place. Ask other classmates who scrapbook for ideas...
Note the length and the angle of each leg of your trip. You must resolve this into component vectors using a diagram and trig functions.
NOTE: You can take a partner on your trip, but the reflection must be done individually.
REFLECTION QUESTIONS
- When you are finished, determine the net displacement from Manchester to your last location. Include a vector heading. Compare this to the value created by your component vectors. DO THEY MATCH? WHY or WHY NOT? (I will show you how to do this on Day 3)
- Reflection questions that must be answered INDIVIDUALLY on the back of one of the graph sheets.
b) Based on the component vectors and the curvature of the earth, could we easily determine a scale where 1cm = _____ miles. Why or why not?
c) How does a GPS use vector determinations as it calculates location? Did this give you any unexpected results? Explain.
d) Give three examples where a vector must be exact to the nearest mm.
e) Give three examples where a vector must be exact to the nearest m.
f) Give three examples where a vector must be exact to the nearest km.
g) Given what you have learned about vectors, when are scale drawings useful? When should you switch from a paper map to a digital device?
h) What did you learn during this project?
Friday, March 4, 2011
Vector Assignment
Do FOUR of the following to pass
Do SIX of the following to get an A for this assignment.
For each problem, draw a diagram, and find the information shown. List the needed trig function.
===============================
1. Joyce walks 3 miles E and 4 miles South. What is her hypoteneuse? What is the angle?
2. Curt swims across a wave pool at 2 m/s, The cross current is at a perpendicular to him at a speed of 1/2 m/s. Which way will the water take him? Show an angle and a resulting speed.
3. An airplane is traveling 300 mi/hr west, and a cross wind is bearing down at 30 mi/hr south. What angle and resultant speed will result?
4. Gary pushes down on a lawnmower handle with a speed of 1 m/s, directed at a 45 degree angle. What is the effective forward speed?
5. If a soccer player kicks a ball with a speed of 12 m/s at an angle of 140 degrees, what is the east and south component?
6. A golf course hole is 300 yds long, and oriented at a heading of 190 degrees. What are the south and western components?
7. If a car drives at 55 mi/hr perfectly SW, what is the southern component? What is the northern component?
8. A bicyclist travels 30 miles west and 40 miles north. How far is she from her starting point? What is her angle of orientation?
Tuesday, March 1, 2011
Vector Golf

Step 1: You, along with one other designer , will be putting together a 9-hole golf course. The maximum area available for the golf course is a land area that is 1760 yds by 1760 yds (you do not need to use all the land). A lovely creek (not a river) runs through the land, and there are trees on two edges, and a housing development on a third. You will need to have PAR information to do this, but these values are approximate, so you do have some leeway.
For the purpose of this activity, cost is no object, so trees and sand traps can be added at will.
Establish a scale: __________ yards = 1 cm
Orange: 5 cm = 10 yds
Blue: 10 cm = 15 yds
Yellow: 10 cm = 20 yds
Draw a detailed sketch of your course using the paper by the meter sticks and hand in. Make sure you have added a compass rose and have marked the scale on your paper. Color the course using colored pencils or crayons.
Provide a vector length and heading for the first leg of each hole (We will do this on Monday).
Hints: Club houses are often 6000-15000 sq. ft. Houses are often 1800-4000 sq. ft., with the upper range representing a mansion-style home.If you choose to make a mini-golf course, you have an area that is 100 yds by 500 yds, and must include a clubhouse, a parking lot, 9 holes of golf, and a snack shop On one side of the course must be a go-kart course.
Hint: Google 'golf course design' if you need a sample to get ideas.
Step 2 :
Each person in your group will make a scale drawing of one hole, using a scale of 3 cm = 120 yards, in Power Point. The scale drawing will be done digitally using Power Point, but three copies of the hole must be handed in. Label the drawing with a hole number, mark the tee with a T, and the hole in a flag. Make sure the compass rose on this drawing matches the orientation of the hole on t he master course. The master course must also be handed in.
Thursday, February 24, 2011
Physics of Sports on the Moon
Please add the following to your project using the Active Physics SPORTS book in the front of the room. You must show your work to get credit.
p. 118-119 #3. a-g
p. 122 #6
p. 127 #1, #4
p. 134, #1-#4
p. 139, #1-#6
P. 145, #1
p. 118-119 #3. a-g
p. 122 #6
p. 127 #1, #4
p. 134, #1-#4
p. 139, #1-#6
P. 145, #1
Wednesday, February 16, 2011

Over the next three days, you will be creating a spreadsheet that details the use of motion in Cartoon Physics. Before you start, you must pick a video and identify where you feel constant velocity, uniform horizontal acceleration and uniform vertical acceleration Make a short movie of these three segments using Windows Live Movie Maker.
Cartoon Name:
Constant Velocity:
Uniform Horizontal Acceleration
Uniform Vertical Acceleration
Thursday, January 27, 2011
Wednesday, January 12, 2011
What is the purpose of CERN?

a) talking with members of different countries
b) medical technologies
c) the grid
d) the energy needed
e) the construction costs
f) the use of energy
g) the discoveries for physics
h) the age of the universe
http://public.web.cern.ch/public/en/About/About-en.html
Physics of Today
http://www.particleadventure.org/
Get one or two partners. Your mission: to find out how physics has changed, what the physics of today looks like, and what we still don't know.
For each section below, you will need to come up with a top FIVE facts list.
Standard Model
Forces Game
The Accelerator Lab
How to Accelerate Game
Trails Game
Mysteries to Solve
Tuesday, January 11, 2011

Monday, January 10, 2011
Thursday, January 6, 2011
Radioactivity Primer
FINDING OUT ABOUT THE NUCLEUS
Thomsen's Experiment
Rutherford's Model
Chadwick and Millikan
RADIATION AND PROBABILITY
The Basics
The Dosages and Such
Thomsen's Experiment
Rutherford's Model
Chadwick and Millikan
Watch the full episode. See more NOVA.
The Basics
The Dosages and Such
Tuesday, January 4, 2011
What is a Detector?
Today, we talked about rules and detectors. Sometimes detectors are inadequate for us to find all the rules. What we do in physics mirrors that. We need to collect enough data, using appropriate detectors, to help us fill out the rules.
Subscribe to:
Comments (Atom)