Thursday, October 24, 2013

Vector Benchmark


As a culture, we have increasingly become reliant on GPS technology.  Farming, map-making, navigation, surveying, and military identification are increasingly connected to this network of satellite locations. 

Project:


GROUP PART
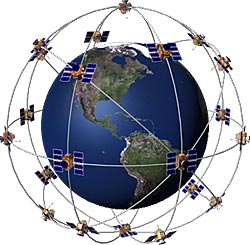
A.   Explain to me, using a picture, how GPS works.  Upload this picture to your Google Drive.
B. Use Google Maps/Google Earth and find the exact location of five landmarks  to tell a story.  This could be anything from famous Iowans to places where Laura Ingalls Wilder slept---use your imagination.

INDIVIDUAL PART
Create a series of vector representations that tell me how far each landmark is from the bell of the school.  List the starting GPS coordinate to the nearest minute, the final GPS coordinate to the nearest minute, the path length/degrees, and the two legs.  Show work.


GROUP PART
 Use your understanding of GPS and/or Vectors to explain how one of the topics below work, it's advantages, disadvantages, and if your group would recommend it.
 Include a sample physics problem associated with this topic, concrete examples and graphics as appropriate, along with a Resource sheet.

You may choose something else, but here are topics to consider:
  • How 4Square and Facebook check-in work.  Advantages and disadvantages. (I'd suggest checking in at least 10 places in the Mantown area if you do this.  Use Google Earth to find the exact latitude and longitude)
  • Developing a Geocaching Hunt (Brrr...if you do this, it will be cold.  Make a hunt, but then explain exactly HOW you did it.  If you have an app to do that, explain it.)
  • Precision Agriculture (check out many of the online farm journals, or agleader.com, or other sites.  Why do they have to sample the fields to use this technology? How accurate is it? Do you want to have tractors with auto-steering?  Is this the future of farming?)
  • Military Drone Targeting (Type in a location, and a remote control bomb can drop on a location half-way across the world.  Human rights activists suggest that this technology is not as accurate as it should be, and many civilans have been harmed.)
  • Discoveries using Google Earth (military secrets, shipwrecks and hidden treasure, and perhaps undiscovered archeological finds....all from your armchair.   Where have these things been found?  What is the GPS location of some of these secrets?)
  • Using Vector-scaled technology in Powerpoint and Adobe Illustrator
  • Problems and Foibles with your Automatic Navigator (at what point should you stop listening to the voice and use your common sense?  What about the Apple Maps fiasco?  Where do the maps used in these applications come from, anyway?)
  • A GPS can be installed on cars to track a fleet, a rental car, or to check the habits of drivers in your family.    Is this the future of insurance?  Is it a benefit or an intrusion?  How do these things work?)
  • Navigation in Flight (What does it take to to be a aeroflight navigator, and how is it different than the Google Tours we just put together?  How has GPS replaced sin, cos, and tan and the Pythagorean theorem needed by navigators of the mid-century last year?
  • 3d printing is an application of vectors that can be used for a variety of purposes:  DIY hands

Grading:  
Presentation (this can be a flipped video to show to the class or you can present)--15
Digitized artifacts (upload everything to a Google Drive folder, and then share with me)--15
Demonstrated Understandings in Physics related to vectors and/or GPS--15
Quality/Resources--15

Wednesday, October 23, 2013

Trip Around the District


View Larger Map

Here are the places we spoke of yesterday.

Pick 5, and using the paper map, make an 'as-the-crow-flies' round-trip journey  Label each of these legs A, B, C, D, and E

Make a vector heading for each.

Break each Vector into components.

Calculate the net displacement for N-S and E-W


Tuesday, October 22, 2013

Map My Run Redux

Resolved:  Should Map My Runn be used as an alternative to circuits in PE class?

This is an opportunity to use non-flaming comments.

Base your comments on the following:


  • people's access to smart devices
  • the ability to game the system
  • the desire for people to live healthy lifestyles beyond that of a class
  • the ability of the app to track vectors

Comments must have your name.  You will be required to comment on someone else's statement in a way that extends the conversation.

Wednesday, October 16, 2013

Google Tour Vacation

You are headed on a dream vacation! Start at Manchester, and zoom around the globe using Google Earth in the North Lab. At least one place must be south of the equator, and place east of London. As you travel (on at least ten stops), keep track of the latitude and longitude for each place, and the vector heading from point to point

http://googleearthdesign.blogspot.com/2009/02/howto-create-simple-tour.html


Monday, October 14, 2013

Golf Course Info


Step 1: You, along with one or other designers , will be putting together a 9-hole golf course.  A lovely creek (not a river) runs through the land, and there are trees on two edges, and a housing development on a third. You will need to have PAR information to do this, but these values are approximate, so you do have some leeway.

For the purpose of this activity, cost is no object, so trees and sand traps can be added at will.

Establish a scale: ___10___ yards = 1 cm (unless you checked with instructor)

Draw a detailed sketch of your course using the paper by the meter sticks and hand in. Make sure you have added a compass rose and have marked the scale on your paper.   
Provide a vector length and heading for the first leg of each hole (We will do this on Monday).

Hints: Club houses are often 6000-15000 sq. ft. Houses are often 1800-4000 sq. ft., with the upper range representing a mansion-style home.
If you choose to make a mini-golf course,  include a clubhouse, a parking lot, 9 holes of golf, and a snack shop On one side of the course must be a go-kart course.

Monday, October 7, 2013

Putting the Pieces Together on an Individual Blog

Create a blog using Blogger.

Upload your video pieces, or embed the You Tube Clips.

Take screenshots of the data analysis.  The number--as many as necessary, with captions added.

Answer the questions for the group reflection.

DO NOT simply answer these as #1, #2, etc.   You will lose points if you do.

Share the blog title with me.

Tuesday, October 1, 2013

Stop Motion Movie

Video Analysis of Animated Motion

How good is it?  That is that question videographers have to ask each day when they put together animations, whether it it something that is created in 3d (Blender or Maya), or even a stop motion movie.


linked from http://capsicumsunset.files.wordpress.com/2008/09/wile_e_coyote-gravity-lessons.jpg
In original animations, each picture was drawn on a cellulose or acetate sheet, and then a picture was taken of each.   If you look at it frame by frame, you can see that sometimes the images were 'padded' or the same image was used twice in a film to cut down on work for the animators.  We do this today with stop motion animation, an extension of the techniques that have been around since the claymation movies.

A History of Animation tells this story well.  Animation single cells are now sold as collector pieces

In the past five years, this hand-animation has experienced a bit of a renaissance, with both Pixar and Disney doing some still work.  It takes very simple tools.

Digital tweenings then started to take over, with wire-frame animation and user-friendly programs like Flash.  These gave way to more robust programs with physics engines and 3D graphical modeling which have boosted the CGI and animation industries.  

Your project is to look at the physics of motion in movie clips.  You can do this in a variety of ways, but you will need to analyze what is created using Logger Pro.  This includes segments on constant motion, on acceleration and deceleration, and vertical motion.

Possible options include

  • making a stop motion movie
  • comparing two types of animation

Print or save each of the the Logger Pro analyses, and email them to me, as well as any video products you create.


Grading Rubric is here


=========
Group Reflection (Presentation or Linoit)  Using v(i), v(f), d, a, and t variables

1.  How well did you or others animate this project?  What specific evidence do you have to support your claim?
2.   What are three things that could have been done better in this project to mimic reality?  Again, show specific evidence.
3.   Identify a .2 sec time interval.  Identify the initial v(i), and the v(f).  Calculate an acceleration in m/s/s and calculate the distance traveled.  SHOW FORMULAS used.
4.  Find a place where the y-velocity is decreasing for .1 seconds.  Identify the v(i), the distance traveled, and calculate the acceleration in m/s/s.  SHOW FORMULAS used.
5.  Find a place where the x-velocity is relatively constant.  Identify data and calculate the acceleration.  How close does this data match to the assumption that acceleration should be zero?   SHOW FORMULAS used.
6.  Based on your work, and work done in class, which do you believe is the best type of animation:  a) hand-drawn, b) stop-motion movement, c) computer-animated children's programs, d) computer-animated for motion picture movies.    Explain this to me in 2 or more paragraphs, listing advantages and disadvantages of each.