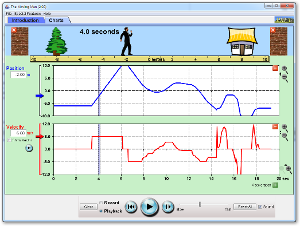
Then, head to the Moving Man Simulation found at PHET by clicking the link below:
CLICK ON THE CHARTS TAB
- For trial 1, enter in the following values: x=0, v=0, a = +1
- For trial 2, enter in the following values: x=0, v=0, a = -1
- For trial 3, enter in the following values: x=0. v=0, a = -1
The graphs in simulation should mimic what you have in logger pro, but with one difference: the a-t graph is valid. Logger pro is not good at generating a-t graphs using a motion detector. Discussion questions to consider include:
- What would a dot diagram look like for each of the situations? Be sure to mark zero.
- Are you able to calculate the slope of the d-t or v-t graphs? Why or why not?
- What's the difference between a slope of an interval and a slope of an instant?
- How could you calculate the slope of an instant? Explain.
- What does the area under a v-t or a-t graph tell you? Explain?

No comments:
Post a Comment